Austria – AT
More on wikipedia wikidata Q40 on OpenStreetMap Austria slovensky: AT
Subregions: East Austria, Southern Austria, Western Austria
Unemployment
| Indicator | Period | Value |
|---|---|---|
| Unemployment | ||
| unemployment rate | 2022 | 4.8 |
| youth unemployment rate | 2022 | 9.5 |
| unemployment rate of low educated people | 2023q4 | 11.3 |
| Long term unemployment | ||
| long term unemployment | 2023q4 | 1.1 |
| share of long term unemployed | 2023q4 | 21.9 |
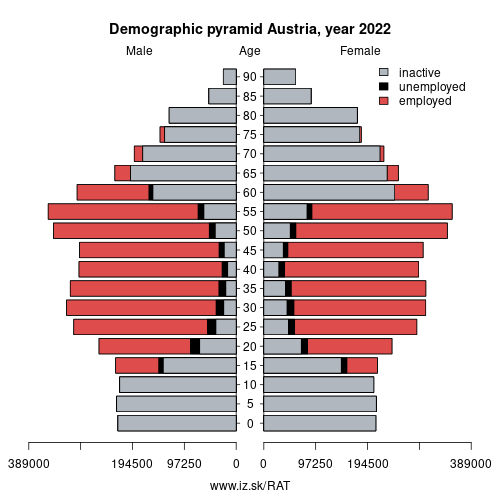
Composition of population according to age group, education and economic activity, Austria
| Age group | Low education | Middle education | High education |
|---|---|---|---|
| Y20-29 | P: 122.0 E: 69.0; U: 14.4; I: 38.6 | P: 554.0 E: 434.7; U: 27.8; I: 91.5 | P: 378.8 E: 305.7; U: 14.9; I: 58.2 |
| Y30-39 | P: 146.7 E: 92.2; U: 14.7; I: 39.8 | P: 548.3 E: 477.8; U: 21.0; I: 49.5 | P: 540.6 E: 487.8; U: 16.6; I: 36.2 |
| Y40-49 | P: 154.2 E: 106.2; U: 12.3; I: 35.7 | P: 572.0 E: 510.9; U: 18.5; I: 42.6 | P: 450.1 E: 417.5; U: 9.6; I: 23.0 |
| Y50-59 | P: 225.1 E: 138.0; U: 11.4; I: 75.7 | P: 765.4 E: 636.0; U: 20.8; I: 108.6 | P: 391.2 E: 346.1; U: 10.3; I: 34.8 |
| Y60-69 | P: 242.6 E: 30.7; U: 2.1; I: 209.8 | P: 599.9 E: 117.2; U: 3.6; I: 479.1 | P: 252.6 E: 100.0; U: 3.1; I: 149.5 |
Note: in thousands in 2022, according to labour force sample survey. P – total population, E – employed, U – unemployed, I – number of ecnomically inactive
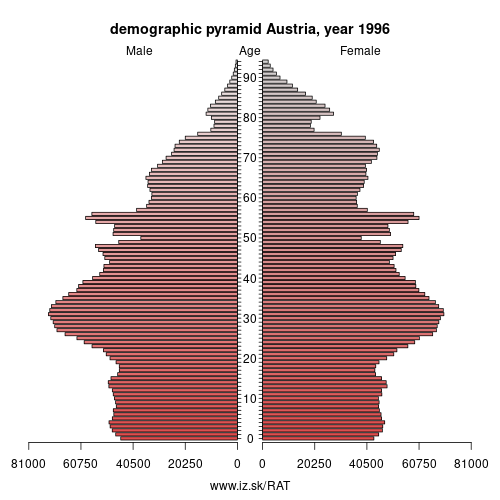
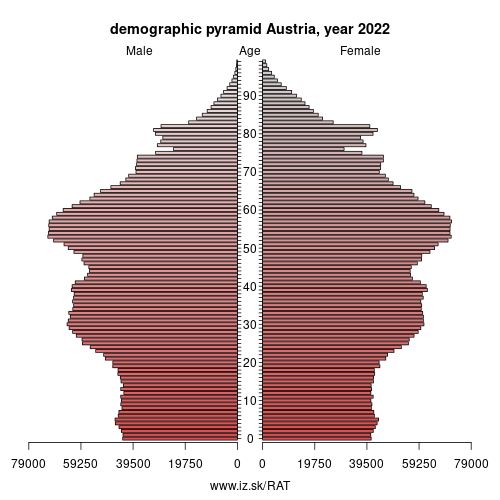
Demographics
| Indicator | Period | Value |
|---|---|---|
| Demographics | ||
| number of inhabitants | 2023 | 9.104772e+06 |
| population density | 2022 | 109.6 |
| old-age dependency ratio | 2023 | 29.6 |
| Population ageing | ||
| unemployment rate – over 55 years | 2023q4 | 3.7 |
| aggregate replacement ratio | 2022 | 0.57 |
| aggregate replacement ratio – females | 2022 | 0.6 |
| life expectancy of a 50 year old | 2021 | 32.7 |
| healty life expectancy at 50 years | 2021 | 18.4 |
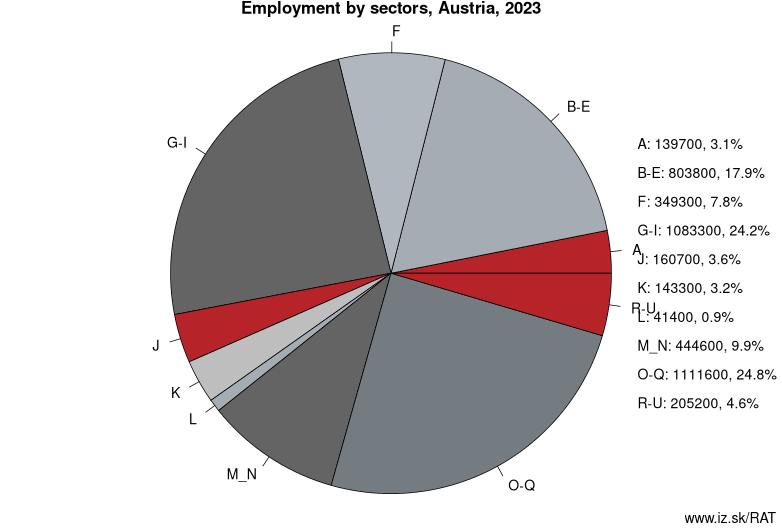
Employment by sectors, Austria
| NACE r2 | % | NACE r2 | % | ||
|---|---|---|---|---|---|
| A | 157.2 | 4 % | B-E | 804.2 | 18 % |
| F | 367 | 8 % | G-I | 1064.6 | 24 % |
| J | 159.8 | 4 % | K | 139.1 | 3 % |
| L | 37.9 | 1 % | M_N | 430.8 | 10 % |
| O-Q | 1086.1 | 24 % | R-U | 195.6 | 4 % |
| TOTAL | 4442.5 | 100 % |
Data for the period year 2022. Source of the data is Eurostat, table [lfst_r_lfe2en2].
Austria ( (listen), ; German: Österreich [ˈøːstɐraɪç] (listen)), officially the Republic of Austria (German: Republik Österreich, listen ), is a country in Central Europe comprising nine federated states. Its capital, largest city and one of nine states is Vienna. Austria has an area of 83,879 km2 (32,386 sq mi), a population of nearly nine million people and a nominal GDP of $477 billion. It is bordered by the Czech Republic and Germany to the north, Hungary and Slovakia to the east, Slovenia and Italy to the south, and Switzerland and Liechtenstein to the west. The terrain is landlocked and highly mountainous, lying within the Alps; only 32 % of the country is below 500 m (1,640 ft), and its highest point is 3,798 m (12,461 ft). The majority of the population speaks local Bavarian dialects as their native language, and German in its standard form is the country's official language. Other regional languages are Hungarian, Burgenland Croatian, and Slovene.
Austria played a central role in European history from the late 18th to the early 20th century. It initially emerged as a margraviate around 976 and developed into a duchy and later archduchy. In the 16th century, Austria started serving as the heart of the Habsburg Monarchy and the junior branch of the House of Habsburg – one of the most influential royal houses in history. As archduchy, it was a major component and administrative centre of the Holy Roman Empire.
Neighbours: Slovakia, Hungary, Liechtenstein, Slovenia, Czech Republic, Switzerland, Italy, Germany
Subregions: East Austria, Southern Austria, Western Austria
Suggested citation: Michal Páleník: Europe and its regions in numbers - Austria – AT, IZ Bratislava, retrieved from: https://www.iz.sk/PAT, ISBN: 978-80-970204-9-1, DOI:10.5281/zenodo.10200164
 Share
Share Facebook
 Twitter
 News
News