East Flanders – BE23
EU regions: Belgium > Flemish Region > East Flanders
| Indicator | Period | Value |
|---|---|---|
| Life long learning | ||
| life long learning participation | 2022 | 12.2 |
| Part time jobs and flexible employment | ||
| percentage of part time workers | 2022 | 23.42 |
| percentage of part time workers, men | 2022 | 10.87 |
| percentage of part time workers, women | 2022 | 37.26 |
| Gender differences | ||
| gender gap in employment rate | 2022 | 93.64 |
| gender gap in unemployment rate | 2022 | 90.48 |
| Graduates and young people | ||
| unemployment rate of youth with elementary education | 2020 | 18.9 |
| NEET | 2022 | 5.2 |
| Gross domestic product | ||
| GDP per capita in PPS of EU average | 2022 | 112 |
| Employment | ||
| employment rate | 2022 | 74.7 |
More on wikipedia wikidata Q1114 on OpenStreetMap East Flanders slovensky: BE23
Subregions: Arrondissement of Aalst, Arrondissement of Dendermonde, Arrondissement of Eeklo, Arrondissement of Ghent, Arrondissement of Oudenaarde, Arrondissement of Sint-Niklaas
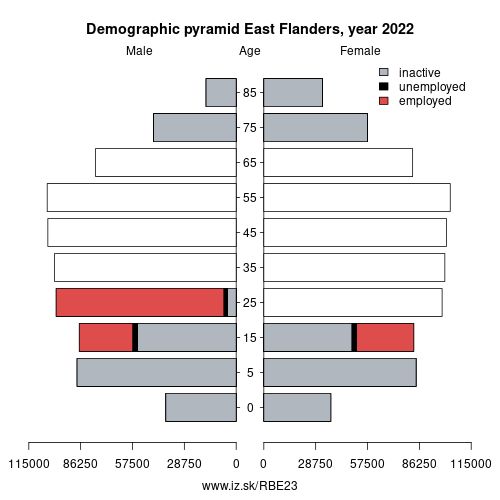
Unemployment
| Indicator | Period | Value |
|---|---|---|
| Unemployment | ||
| unemployment rate | 2022 | 2 |
| youth unemployment rate | 2022 | 8.1 |
| Long term unemployment | ||
| long term unemployment | 2022 | 0.3 |
| share of long term unemployed | 2022 | 15 |
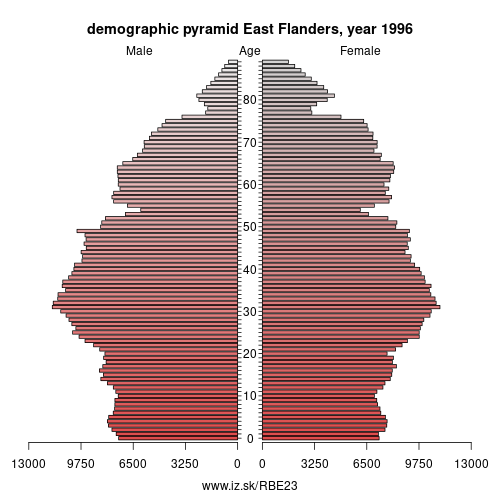
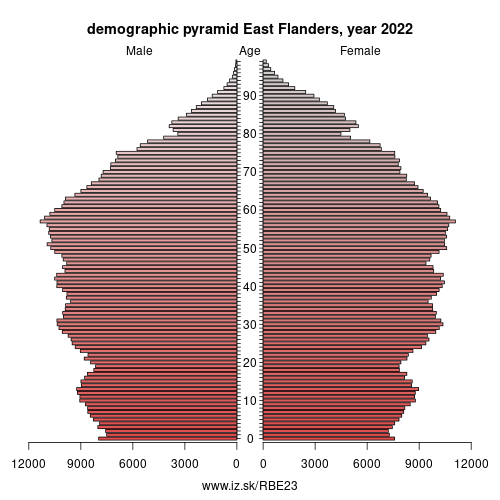
Demographics
| Indicator | Period | Value |
|---|---|---|
| Demographics | ||
| number of inhabitants | 2023 | 1.563346e+06 |
| population density | 2022 | 523.4 |
| old-age dependency ratio | 2023 | 32 |
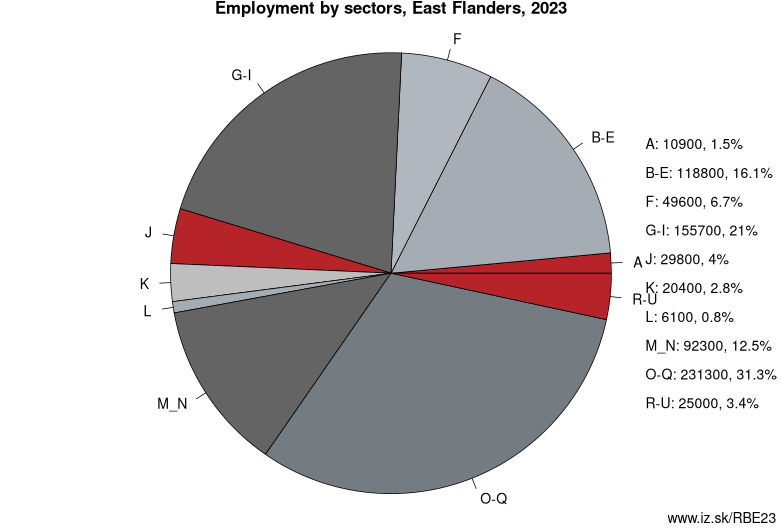
Employment by sectors, East Flanders
| NACE r2 | % | NACE r2 | % | ||
|---|---|---|---|---|---|
| A | 8 | 1 % | B-E | 114.6 | 15 % |
| F | 47.5 | 6 % | G-I | 145.7 | 20 % |
| J | 30.8 | 4 % | K | 28.7 | 4 % |
| L | 5.9 | 1 % | M_N | 91.5 | 12 % |
| O-Q | 245.8 | 33 % | R-U | 26.4 | 4 % |
| TOTAL | 744.8 | 100 % |
Data for the period year 2022. Source of the data is Eurostat, table [lfst_r_lfe2en2].
Other: Flemish Region, West Flanders, Flemish Brabant, Limburg, East Flanders, Province of Antwerp
Neighbours: Hainaut, West Flanders, Province of Antwerp, Flemish Brabant, Zeeland
Subregions: Arrondissement of Aalst, Arrondissement of Dendermonde, Arrondissement of Eeklo, Arrondissement of Ghent, Arrondissement of Oudenaarde, Arrondissement of Sint-Niklaas
Suggested citation: Michal Páleník: Europe and its regions in numbers - East Flanders – BE23, IZ Bratislava, retrieved from: https://www.iz.sk/PBE23, ISBN: 978-80-970204-9-1, DOI:10.5281/zenodo.10200164
 Share
Share Facebook
 Twitter
 News
News