Luxembourg – BE34
EU regions: Belgium > Walloon Region > Luxembourg
| Indicator | Period | Value |
|---|---|---|
| Life long learning | ||
| life long learning participation | 2022 | 9.5 |
| Part time jobs and flexible employment | ||
| percentage of part time workers | 2022 | 27.69 |
| percentage of part time workers, men | 2022 | 10.06 |
| percentage of part time workers, women | 2022 | 47.98 |
| Gender differences | ||
| gender gap in employment rate | 2022 | 88.47 |
| gender gap in unemployment rate | 2022 | 136.59 |
| Graduates and young people | ||
| NEET | 2022 | 5.5 |
| Gross domestic product | ||
| GDP per capita in PPS of EU average | 2022 | 72 |
| Employment | ||
| employment rate | 2022 | 67.1 |
More on wikipedia wikidata Q1126 on OpenStreetMap Luxembourg slovensky: BE34
Subregions: Arrondissement of Arlon, Arrondissement of Bastogne, Arrondissement of Marche-en-Famenne, Arrondissement of Neufchâteau, Arrondissement of Virton
Unemployment
| Indicator | Period | Value |
|---|---|---|
| Unemployment | ||
| unemployment rate | 2022 | 4.9 |
| youth unemployment rate | 2020 | 19.1 |
| Long term unemployment | ||
| long term unemployment | 2022 | 1.5 |
| share of long term unemployed | 2022 | 31.3 |
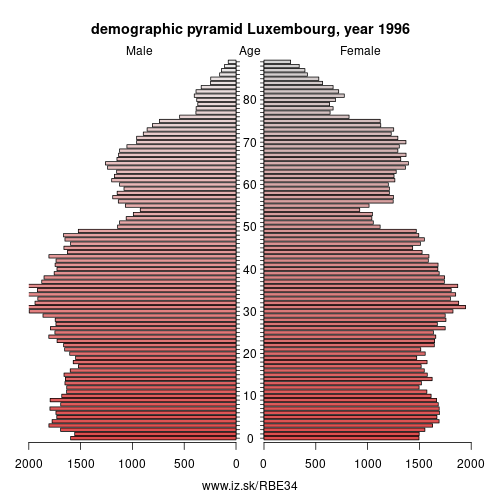
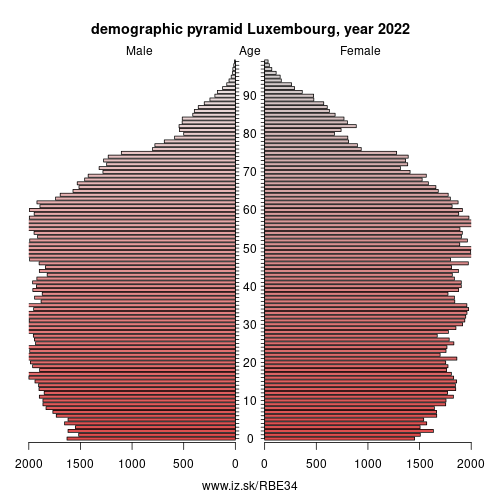
Demographics
| Indicator | Period | Value |
|---|---|---|
| Demographics | ||
| number of inhabitants | 2023 | 297 654 |
| population density | 2022 | 66.4 |
| old-age dependency ratio | 2023 | 27 |
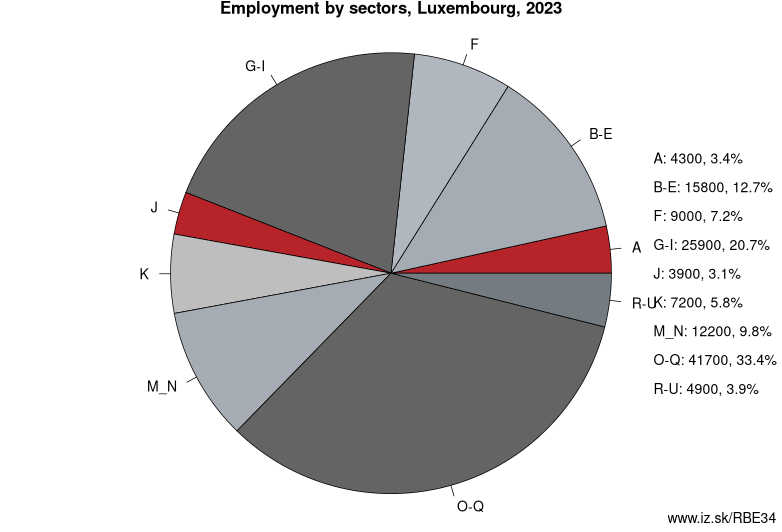
Employment by sectors, Luxembourg
| NACE r2 | % | NACE r2 | % | ||
|---|---|---|---|---|---|
| A | 4.1 | 3 % | B-E | 15.5 | 12 % |
| F | 9.9 | 8 % | G-I | 27.3 | 21 % |
| J | 5.4 | 4 % | K | 6.7 | 5 % |
| M_N | 13.1 | 10 % | O-Q | 41.3 | 32 % |
| R-U | 5.7 | 4 % | TOTAL | 129.2 | 100 % |
Data for the period year 2022. Source of the data is Eurostat, table [lfst_r_lfe2en2].
Other: Walloon Region, Luxembourg, Hainaut, Province of Namur, Province of Liege, Walloon Brabant
Neighbours: Luxembourg, Province of Namur, Lorraine, Champagne-Ardenne, Province of Liege
Subregions: Arrondissement of Arlon, Arrondissement of Bastogne, Arrondissement of Marche-en-Famenne, Arrondissement of Neufchâteau, Arrondissement of Virton
Suggested citation: Michal Páleník: Europe and its regions in numbers - Luxembourg – BE34, IZ Bratislava, retrieved from: https://www.iz.sk/PBE34, ISBN: 978-80-970204-9-1, DOI:10.5281/zenodo.10200164
 Share
Share Facebook
 Twitter
 News
News