Czech Republic – CZ
More on wikipedia wikidata Q213 on OpenStreetMap Czech Republic slovensky: CZ
Subregions: Czech Republic, NUTS2 Region Prague, Central Bohemia cohesion region, Jihozápad, Severozápad, Severovýchod, Jihovýchod, Central Moravia, Moravian-Silesian Region
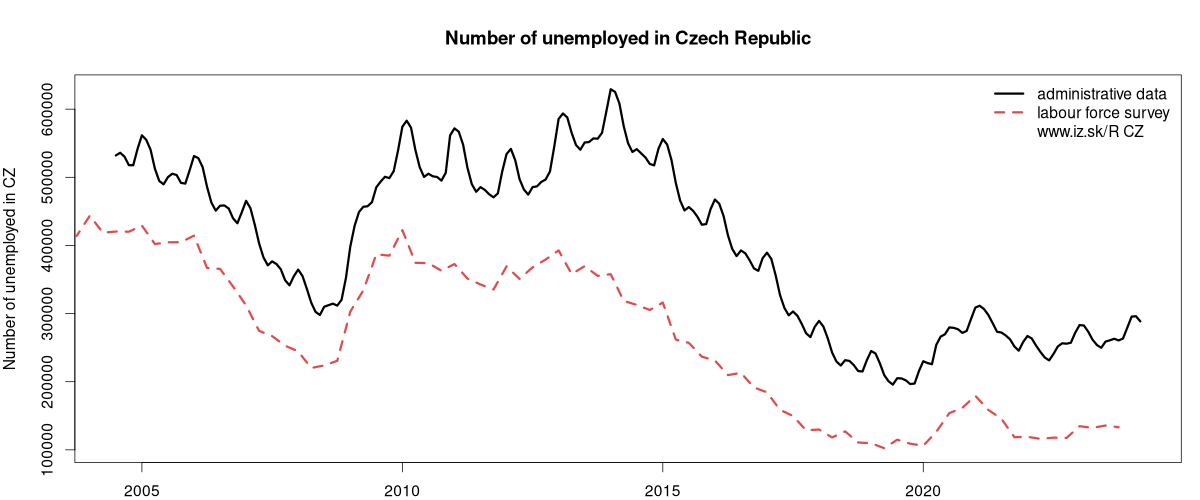
Unemployment
| Indicator | Period | Value |
|---|---|---|
| Unemployment | ||
| unemployment rate | 2022 | 2.3 |
| youth unemployment rate | 2023q4 | 6.5 |
| unemployment rate of low educated people | 2023q4 | 12.1 |
| Long term unemployment | ||
| long term unemployment | 2022 | 0.6 |
| share of long term unemployed | 2023q4 | 26.7 |
| Unemployment according to labour offices | ||
| number of registered unemployed | March 2024 | 288 623 |
| number of unemployed women | March 2024 | 151 998 |
| number of long-term unemployed | March 2024 | 85 491 |
Comparisson of unemployment according to ILO methodology and registered unemployment yeilds some differences.
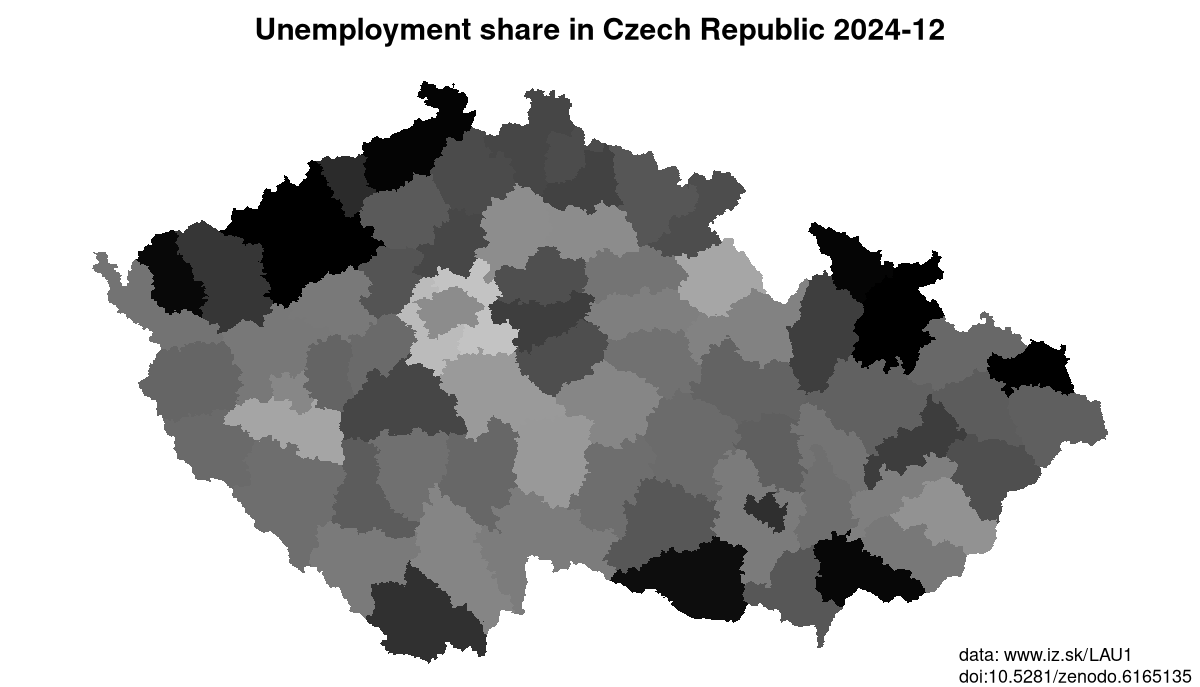
Data on unemployment in counties of Czech Republic are available at Local Administrative Units data of Visegrad countries.
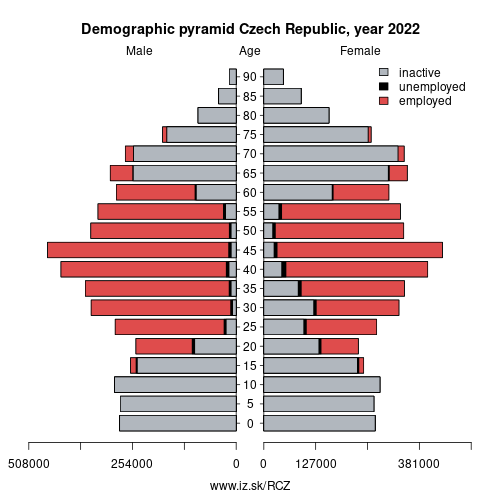
Composition of population according to age group, education and economic activity, Czech Republic
| Age group | Low education | Middle education | High education |
|---|---|---|---|
| Y20-29 | P: 92.5 E: 43.7; U: 7.6; I: 41.2 | P: 712.8 E: 456.9; U: 12.9; I: 243.0 | P: 236.5 E: 167.0; U: 3.2; I: 66.3 |
| Y30-39 | P: 84.9 E: 51.8; U: 7.3; I: 25.8 | P: 813.2 E: 693.7; U: 13.7; I: 105.8 | P: 497.9 E: 402.6; U: 3.3; I: 92.0 |
| Y40-49 | P: 78.3 E: 53.6; U: 6.5; I: 18.2 | P: 1201.0 E: 1120.1; U: 21.3; I: 59.6 | P: 446.6 E: 426.1; U: 4.1; I: 16.4 |
| Y50-59 | P: 61.1 E: 37.4; U: 5.0; I: 18.7 | P: 1041.1 E: 942.8; U: 17.3; I: 81.0 | P: 279.2 E: 270.9; U: 1.8; I: 6.5 |
| Y60-69 | P: 118.0 E: 16.8; U: 1.1; I: 100.1 | P: 933.1 E: 295.6; U: 5.2; I: 632.3 | P: 200.0 E: 114.6; U: 0.9; I: 84.5 |
Note: in thousands in 2022, according to labour force sample survey. P – total population, E – employed, U – unemployed, I – number of ecnomically inactive
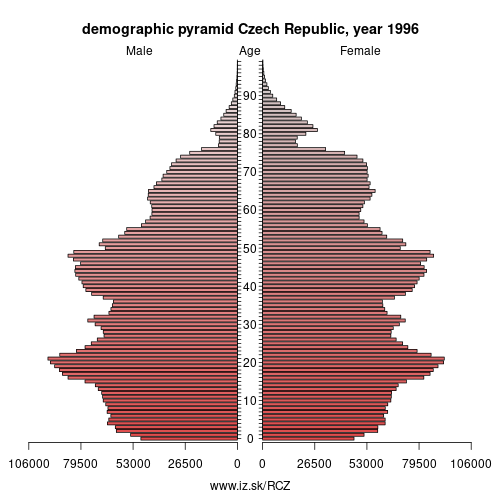
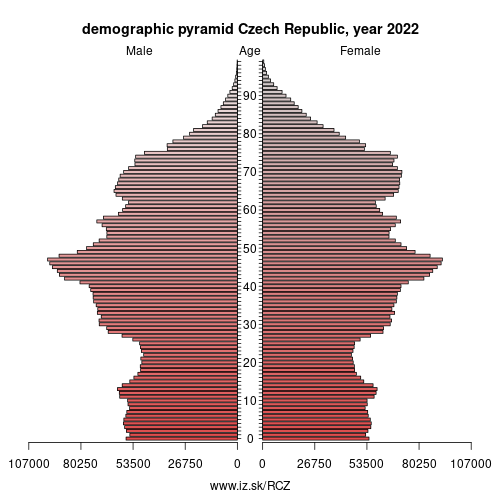
Demographics
| Indicator | Period | Value |
|---|---|---|
| Demographics | ||
| number of inhabitants | 2023 | 1.0827529e+07 |
| population density | 2022 | 138.2 |
| old-age dependency ratio | 2023 | 32.1 |
| Population ageing | ||
| unemployment rate – over 55 years | 2023q4 | 2.1 |
| aggregate replacement ratio | 2023 | 0.52 |
| aggregate replacement ratio – females | 2023 | 0.53 |
| life expectancy of a 50 year old | 2021 | 28.9 |
| healty life expectancy at 50 years | 2021 | 16.9 |
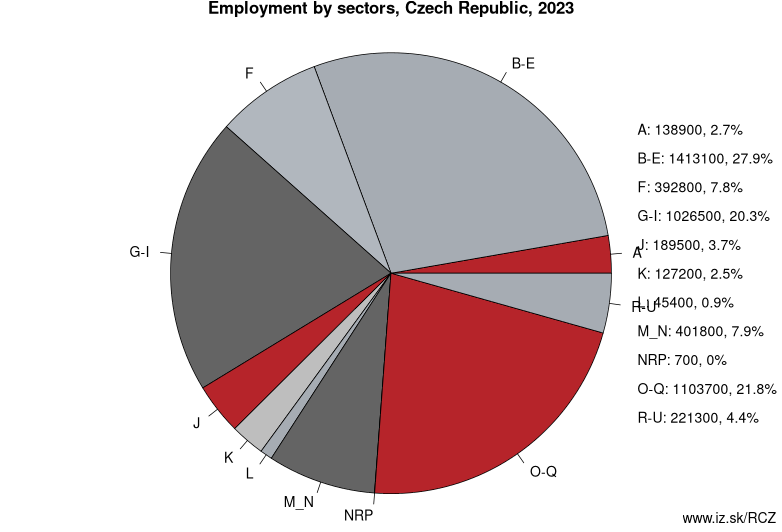
Employment by sectors, Czech Republic
| NACE r2 | % | NACE r2 | % | ||
|---|---|---|---|---|---|
| A | 130.9 | 3 % | B-E | 1478.7 | 29 % |
| F | 406.5 | 8 % | G-I | 1067.1 | 21 % |
| J | 195 | 4 % | K | 122.3 | 2 % |
| L | 45.6 | 1 % | M_N | 380.4 | 7 % |
| O-Q | 1125.7 | 22 % | R-U | 221 | 4 % |
| TOTAL | 5173.5 | 100 % |
Data for the period year 2022. Source of the data is Eurostat, table [lfst_r_lfe2en2].
Other: Switzerland, Czech Republic, Cyprus
Neighbours: Poland, Slovakia, Germany, Austria
Subregions: Czech Republic, NUTS2 Region Prague, Central Bohemia cohesion region, Jihozápad, Severozápad, Severovýchod, Jihovýchod, Central Moravia, Moravian-Silesian Region
Suggested citation: Michal Páleník: Europe and its regions in numbers - Czech Republic – CZ, IZ Bratislava, retrieved from: https://www.iz.sk/PCZ, ISBN: 978-80-970204-9-1, DOI:10.5281/zenodo.10200164
Local Administrative Units data of Visegrad countries
Statistical data on LAU1 regions of Slovakia, Czechia, Poland, Hungary. This LAU1 dataset on 733 regions contains data on population, age structure of inhabitants, on number and structure of unemployed and is regularly updated.. . .
 Share
Share Facebook
 Twitter
 News
News