Tübingen Government Region – DE14
EU regions: Germany > Baden-Württemberg > Tübingen Government Region
| Indicator | Period | Value |
|---|---|---|
| Life long learning | ||
| life long learning participation | 2025 | 9.9 |
| Part time jobs and flexible employment | ||
| percentage of part time workers | 2025 | 33.51 |
| percentage of part time workers, men | 2025 | 13.56 |
| percentage of part time workers, women | 2025 | 55.91 |
| Gender differences | ||
| gender gap in employment rate | 2025 | 93.19 |
| gender gap in unemployment rate | 2025 | 78.12 |
| Graduates and young people | ||
| unemployment rate of youth with elementary education | 2007 | 9 |
| NEET | 2024 | 6.4 |
| Gross domestic product | ||
| GDP per capita in PPS of EU average | 2024 | 122 |
| Employment | ||
| employment rate | 2025 | 80.8 |
| Social exclusion | ||
| people at risk of poverty or social exclusion | 2019 | 14.1 |
Tübingen Government Region slovensky: DE14
Subregions: Reutlingen, Tübingen, Zollernalbkreis, Ulm, Alb-Donau-Kreis, Biberach district, Bodenseekreis, Landkreis Ravensburg, Landkreis Sigmaringen
Unemployment
| Indicator | Period | Value |
|---|---|---|
| Unemployment | ||
| unemployment rate | 2025 | 2.9 |
| youth unemployment rate | 2016 | 4.6 |
| Long term unemployment | ||
| long term unemployment | 2018 | 0.5 |
| share of long term unemployed | 2018 | 27.8 |
Demographics

| Indicator | Period | Value |
|---|---|---|
| Demographics | ||
| number of inhabitants | 2025 | 1 904 079 |
| population density | 2024 | 219.1 |
| old-age dependency ratio | 2025 | 33.9 |
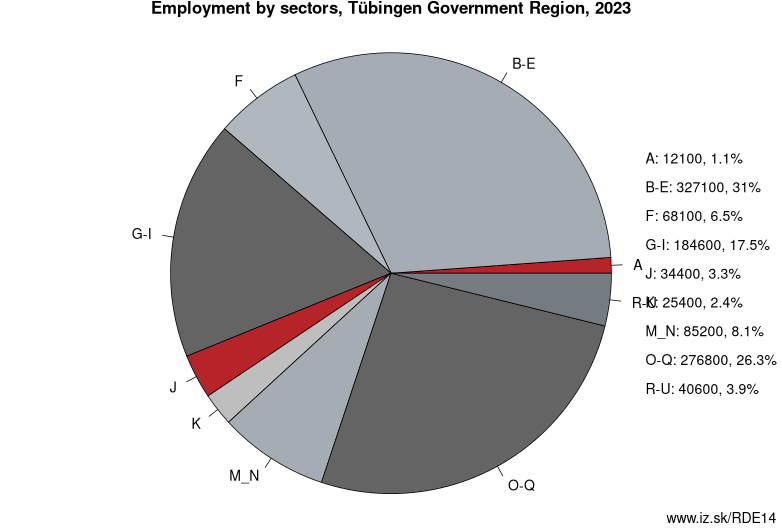
Employment by sectors, Tübingen Government Region
| NACE r2 | % | NACE r2 | % | ||
|---|---|---|---|---|---|
| A | 12.8 | 1% | B-E | 323.6 | 31% |
| F | 65.8 | 6% | G-I | 180.6 | 17% |
| J | 30.7 | 3% | K | 23.5 | 2% |
| M_N | 82.4 | 8% | O-Q | 284.9 | 27% |
| R-U | 40.2 | 4% | TOTAL | 1050.4 | 100% |
Data for the period year 2025. Source of the data is Eurostat, table [lfst_r_lfe2en2].
Other: Baden-Württemberg, Karlsruhe Government Region, Freiburg Government Region, Tübingen Government Region, Stuttgart Government Region
Neighbours: Swabia, Eastern Switzerland, Vorarlberg, Karlsruhe Government Region, Freiburg Government Region, Stuttgart Government Region
Subregions: Reutlingen, Tübingen, Zollernalbkreis, Ulm, Alb-Donau-Kreis, Biberach district, Bodenseekreis, Landkreis Ravensburg, Landkreis Sigmaringen
Suggested citation: Michal Páleník: Europe and its regions in numbers - Tübingen Government Region – DE14, IZ Bratislava, retrieved from: https://www.iz.sk/PDE14, ISBN: 978-80-970204-9-1, DOI:10.5281/zenodo.10200164
 Share
Share Facebook
 Twitter
 News
News