Estonia – EE
More on wikipedia wikidata Q191 on OpenStreetMap Estonia slovensky: EE
Unemployment
| Indicator | Period | Value |
|---|---|---|
| Unemployment | ||
| unemployment rate | 2022 | 5.9 |
| youth unemployment rate | 2022 | 18.6 |
| unemployment rate of low educated people | 2023q4 | 12.7 |
| Long term unemployment | ||
| long term unemployment | 2022 | 1.2 |
| share of long term unemployed | 2023q4 | 21.4 |
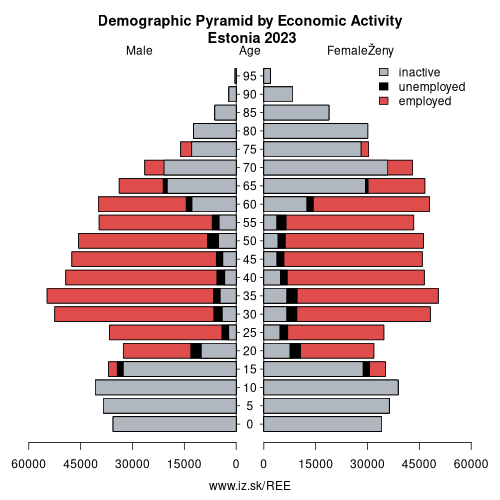
Composition of population according to age group, education and economic activity, Estonia
| Age group | Low education | Middle education | High education |
|---|---|---|---|
| Y20-29 | P: 17.6 E: 10.9; U: 2.4; I: 4.3 | P: 77.2 E: 57.0; U: 6.3; I: 13.9 | P: 37.1 E: 32.7; U: 1.3; I: 3.1 |
| Y30-39 | P: 22.6 E: 15.8; U: 1.5; I: 5.3 | P: 86.6 E: 74.0; U: 4.7; I: 7.9 | P: 88.4 E: 78.7; U: 3.3; I: 6.4 |
| Y40-49 | P: 24.0 E: 18.4; U: 1.1; I: 4.5 | P: 78.0 E: 67.3; U: 3.2; I: 7.5 | P: 80.3 E: 73.6; U: 2.9; I: 3.8 |
| Y50-59 | P: 12.9 E: 8.0; U: 0.8; I: 4.1 | P: 92.0 E: 76.8; U: 3.6; I: 11.6 | P: 65.5 E: 59.8; U: 2.4; I: 3.3 |
| Y60-69 | P: 15.8 E: 4.0; U: 0.2; I: 11.6 | P: 84.3 E: 40.9; U: 1.8; I: 41.6 | P: 63.9 E: 38.6; U: 1.2; I: 24.1 |
Note: in thousands in 2022, according to labour force sample survey. P – total population, E – employed, U – unemployed, I – number of ecnomically inactive
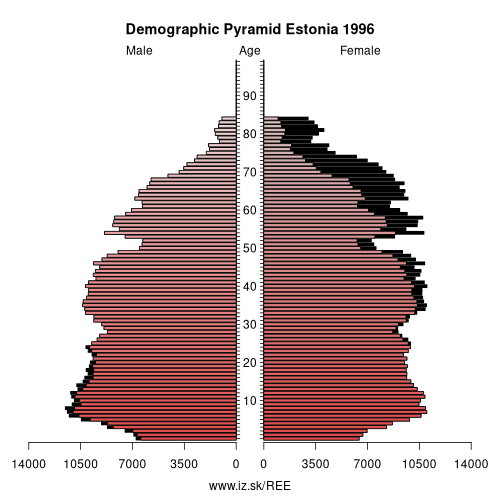
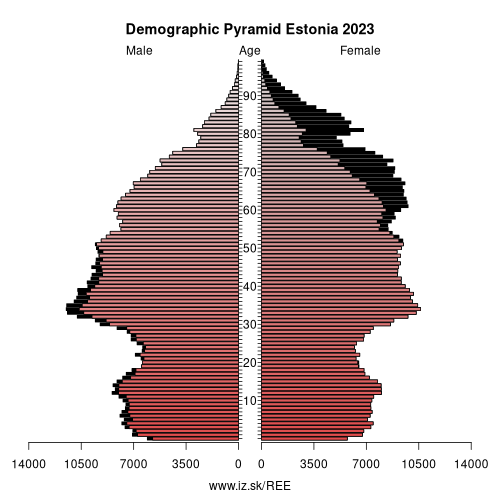
Demographics
| Indicator | Period | Value |
|---|---|---|
| Demographics | ||
| number of inhabitants | 2023 | 1.365884e+06 |
| population density | 2022 | 31 |
| old-age dependency ratio | 2023 | 31.9 |
| Population ageing | ||
| unemployment rate – over 55 years | 2023q4 | 5.1 |
| aggregate replacement ratio | 2023 | 0.46 |
| aggregate replacement ratio – females | 2023 | 0.47 |
| life expectancy of a 50 year old | 2021 | 29.4 |
| healty life expectancy at 50 years | 2021 | 15.1 |
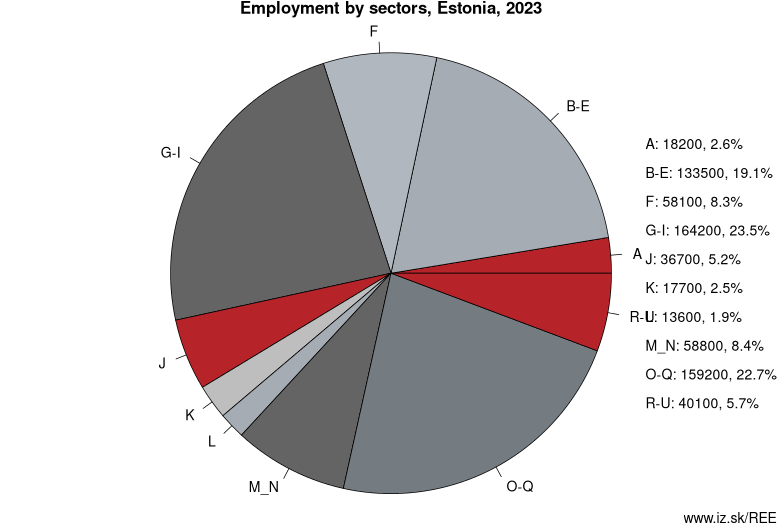
Employment by sectors, Estonia
| NACE r2 | % | NACE r2 | % | ||
|---|---|---|---|---|---|
| A | 17.7 | 3 % | B-E | 136.5 | 20 % |
| F | 58.3 | 9 % | G-I | 162.1 | 24 % |
| J | 36.7 | 5 % | K | 16.9 | 2 % |
| L | 10.6 | 2 % | M_N | 50.5 | 7 % |
| O-Q | 154.5 | 23 % | R-U | 37.1 | 5 % |
| TOTAL | 680.8 | 100 % |
Data for the period year 2022. Source of the data is Eurostat, table [lfst_r_lfe2en2].
Estonia (Estonian: Eesti [ˈeːsʲti] (listen)), officially the Republic of Estonia (Estonian: Eesti Vabariik), is a country on the eastern coast of the Baltic Sea in Northern Europe. It is bordered to the north by the Gulf of Finland with Finland on the other side, to the west by the Baltic Sea with Sweden on the other side, to the south by Latvia (343 km), and to the east by Lake Peipus and Russia (338.6 km). The territory of Estonia consists of a mainland and 2,222 islands in the Baltic Sea, covering a total area of 45,227 km2 (17,462 sq mi), water 2,839 km2 (1,096 sq mi), land area 42,388 km2 (16,366 sq mi), and is influenced by a humid continental climate. The official language of the country, Estonian, is the second-most-spoken Finnic language.
The territory of Estonia has been inhabited since at least 9,000 B.C. Ancient Estonians were some of the last European pagans to be Christianized, following the Livonian Crusade in the 13th century. After centuries of successive rule by Germans, Danes, Swedes, Poles and Russians, a distinct Estonian national identity began to emerge in the 19th and early 20th centuries. This culminated in independence from Russia in 1920 after a brief War of Independence at the end of World War I. Initially democratic, subsequent to the Great Depression, Estonia was governed by authoritarian rule since 1934 during the Era of Silence. During World War II (1939–1945), Estonia was repeatedly contested and occupied by the Soviet Union and Germany, ultimately being incorporated into the former. After the loss of its de facto independence, Estonia's de jure state continuity was preserved by diplomatic representatives and the government-in-exile. In 1987 the peaceful Singing Revolution began against Soviet rule, resulting in the restoration of de facto independence on 20 August 1991.
Other: European Union, Estonia, Greece, Spain
Neighbours: Latvia
Suggested citation: Michal Páleník: Europe and its regions in numbers - Estonia – EE, IZ Bratislava, retrieved from: https://www.iz.sk/PEE, ISBN: 978-80-970204-9-1, DOI:10.5281/zenodo.10200164
 Share
Share Facebook
 Twitter
 News
News