Hungary – HU
More on wikipedia wikidata Q28 on OpenStreetMap Hungary slovensky: HU
Subregions: Central Hungary, Transdanubia, Great Plain and North
Unemployment
| Indicator | Period | Value |
|---|---|---|
| Unemployment | ||
| unemployment rate | 2022 | 3.7 |
| youth unemployment rate | 2022 | 10.6 |
| unemployment rate of low educated people | 2023q4 | 13.2 |
| Long term unemployment | ||
| long term unemployment | 2022 | 1.2 |
| share of long term unemployed | 2022 | 34.2 |
| Unemployment according to labour offices | ||
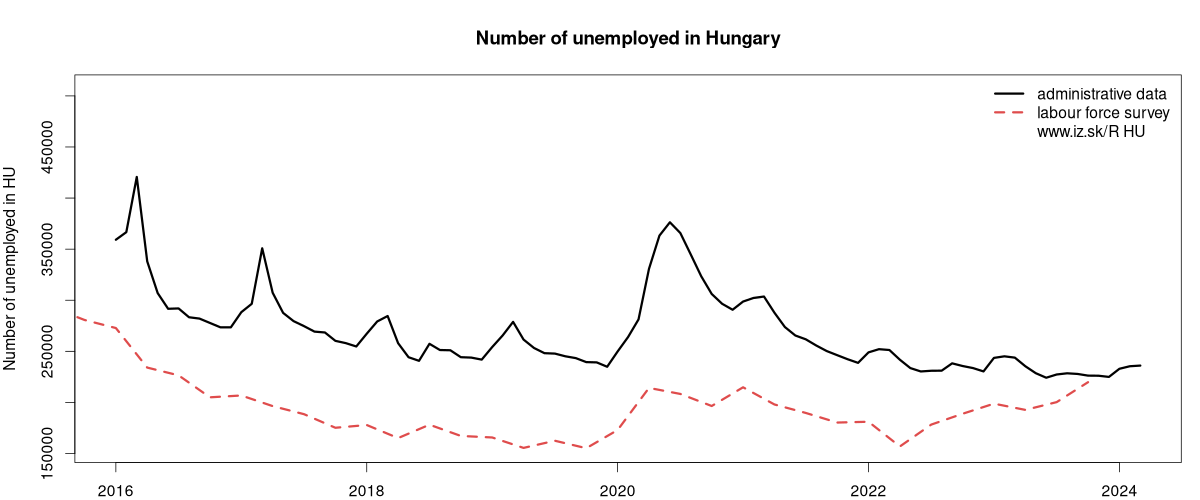
| number of registered unemployed | March 2024 | 236 051 |
| number of unemployed women | March 2024 | 120 184 |
Comparisson of unemployment according to ILO methodology and registered unemployment yeilds some differences.
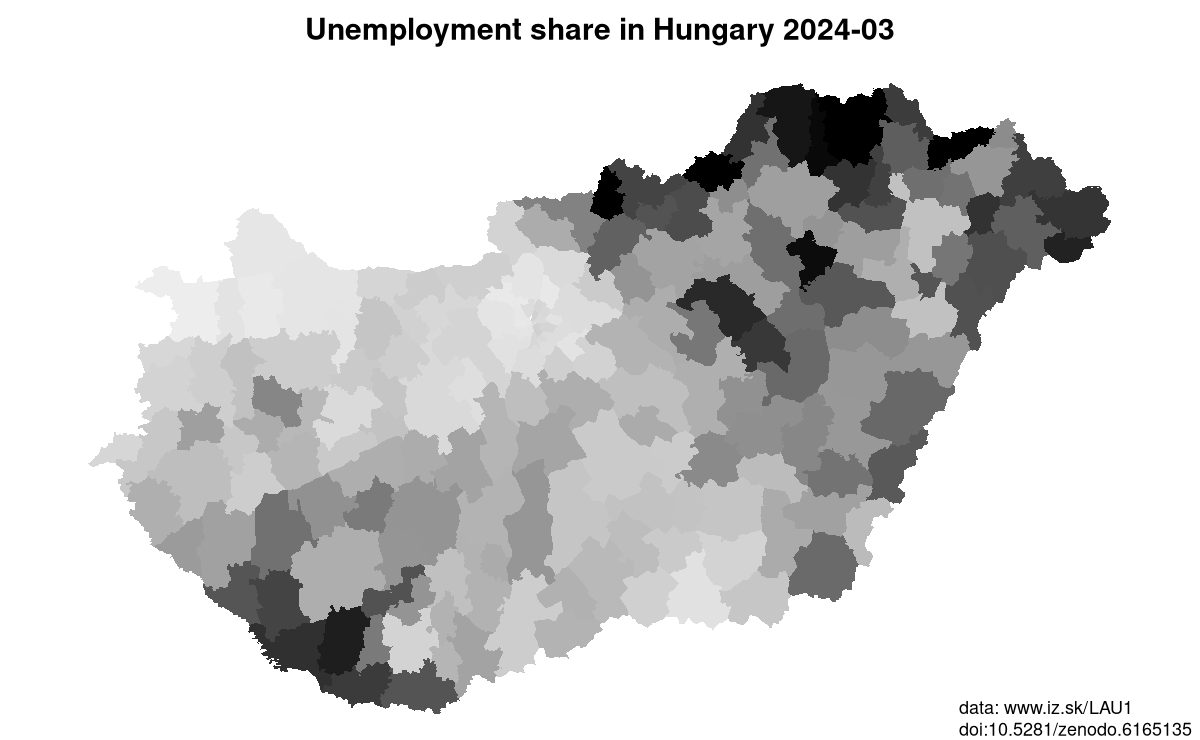
Data on unemployment in counties of Hungary are available at Local Administrative Units data of Visegrad countries.
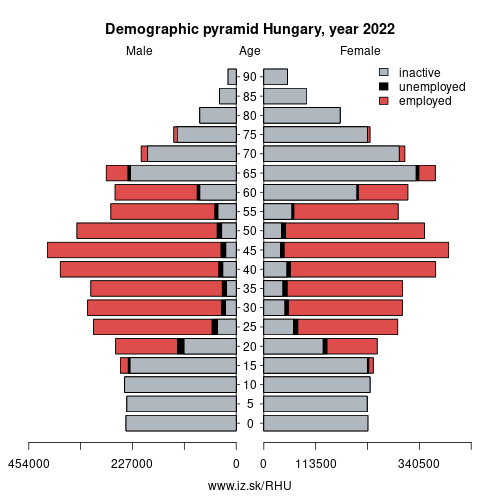
Composition of population according to age group, education and economic activity, Hungary
| Age group | Low education | Middle education | High education |
|---|---|---|---|
| Y20-29 | P: 164.9 E: 85.2; U: 16.2; I: 63.5 | P: 694.2 E: 451.8; U: 23.8; I: 218.6 | P: 214.9 E: 185.1; U: 6.4; I: 23.4 |
| Y30-39 | P: 144.7 E: 93.1; U: 13.2; I: 38.4 | P: 639.7 E: 568.1; U: 19.0; I: 52.6 | P: 442.2 E: 420.2; U: 6.0; I: 16.0 |
| Y40-49 | P: 185.3 E: 129.6; U: 13.0; I: 42.7 | P: 876.4 E: 798.2; U: 20.4; I: 57.8 | P: 494.1 E: 475.7; U: 4.3; I: 14.1 |
| Y50-59 | P: 168.8 E: 103.1; U: 10.7; I: 55.0 | P: 795.9 E: 680.3; U: 19.1; I: 96.5 | P: 300.7 E: 282.2; U: 3.0; I: 15.5 |
| Y60-69 | P: 210.6 E: 33.3; U: 3.2; I: 174.1 | P: 745.3 E: 231.0; U: 7.2; I: 507.1 | P: 255.1 E: 105.6; U: 1.8; I: 147.7 |
Note: in thousands in 2022, according to labour force sample survey. P – total population, E – employed, U – unemployed, I – number of ecnomically inactive
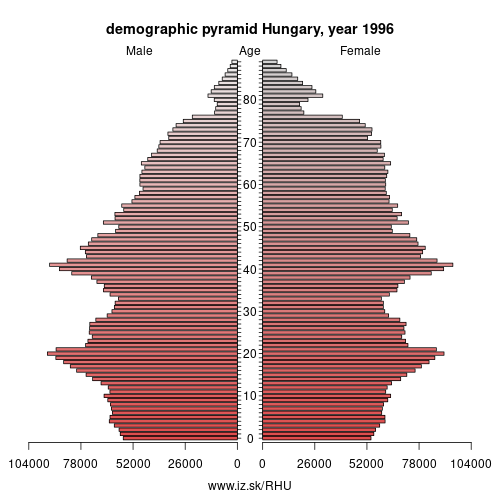
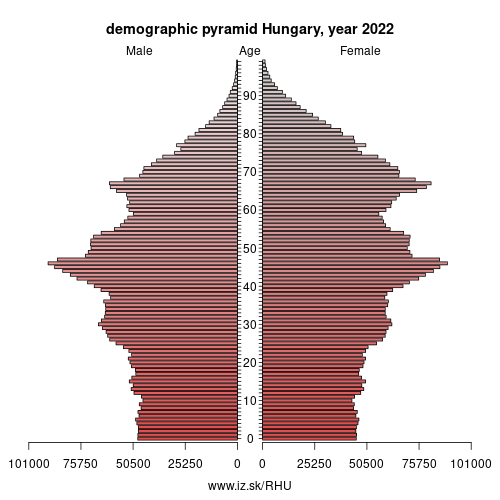
Demographics
| Indicator | Period | Value |
|---|---|---|
| Demographics | ||
| number of inhabitants | 2023 | 9.599744e+06 |
| population density | 2022 | 105.7 |
| old-age dependency ratio | 2023 | 31.6 |
| Population ageing | ||
| unemployment rate – over 55 years | 2023q4 | 3.3 |
| aggregate replacement ratio | 2022 | 0.53 |
| aggregate replacement ratio – females | 2022 | 0.54 |
| life expectancy of a 50 year old | 2021 | 26.4 |
| healty life expectancy at 50 years | 2021 | 16.6 |
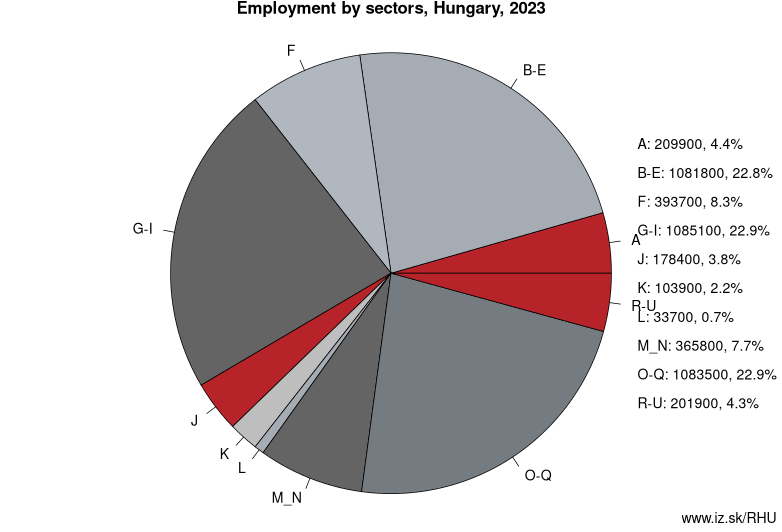
Employment by sectors, Hungary
| NACE r2 | % | NACE r2 | % | ||
|---|---|---|---|---|---|
| A | 205.4 | 4 % | B-E | 1092.8 | 23 % |
| F | 383.7 | 8 % | G-I | 1071.4 | 23 % |
| J | 167.3 | 4 % | K | 99.2 | 2 % |
| L | 36.6 | 1 % | M_N | 364.9 | 8 % |
| O-Q | 1089 | 23 % | R-U | 198.7 | 4 % |
| TOTAL | 4709 | 100 % |
Data for the period year 2022. Source of the data is Eurostat, table [lfst_r_lfe2en2].
Hungary (Hungarian: Magyarország [ˈmɒɟɒrorsaːɡ] (listen)) is a country in Central Europe. Spanning 93,030 square kilometres (35,920 sq mi) in the Carpathian Basin, it borders Slovakia to the north, Ukraine to the northeast, Austria to the northwest, Romania to the east, Serbia to the south, Croatia to the southwest, and Slovenia to the west. With about 10 million inhabitants, Hungary is a medium-sized member state of the European Union. The official language is Hungarian, which is the most widely spoken Uralic language in the world, and among the few non-Indo-European languages to be widely spoken in Europe. Hungary's capital and largest city is Budapest; other major urban areas include Debrecen, Szeged, Miskolc, Pécs and Győr.
The territory of modern Hungary was for centuries inhabited by a succession of peoples, including Celts, Romans, Germanic tribes, Huns, West Slavs and the Avars. The foundations of the Hungarian state were established in the late ninth century CE by the Hungarian grand prince Árpád following the conquest of the Carpathian Basin. His great-grandson Stephen I ascended the throne in 1000, converting his realm to a Christian kingdom. By the 12th century, Hungary became a regional power, reaching its cultural and political height in the 15th century. Following the Battle of Mohács in 1526, Hungary was partially occupied by the Ottoman Empire (1541–1699).
Neighbours: Slovenia, Serbia, Romania, Croatia, Slovakia, Austria
Subregions: Central Hungary, Transdanubia, Great Plain and North
Suggested citation: Michal Páleník: Europe and its regions in numbers - Hungary – HU, IZ Bratislava, retrieved from: https://www.iz.sk/PHU, ISBN: 978-80-970204-9-1, DOI:10.5281/zenodo.10200164
Local Administrative Units data of Visegrad countries
Statistical data on LAU1 regions of Slovakia, Czechia, Poland, Hungary. This LAU1 dataset on 733 regions contains data on population, age structure of inhabitants, on number and structure of unemployed and is regularly updated.. . .
 Share
Share Facebook
 Twitter
 News
News