Italy – IT
More on wikipedia wikidata Q38 on OpenStreetMap Italy slovensky: IT
Subregions: Northwest Italy, South Italy, Insular Italy, Northeast Italy, Central Italy
Unemployment
| Indicator | Period | Value |
|---|---|---|
| Unemployment | ||
| unemployment rate | 2023q4 | 7.7 |
| youth unemployment rate | 2022 | 23.7 |
| unemployment rate of low educated people | 2023q4 | 10.6 |
| Long term unemployment | ||
| long term unemployment | 2023q4 | 4.1 |
| share of long term unemployed | 2023q4 | 54.4 |
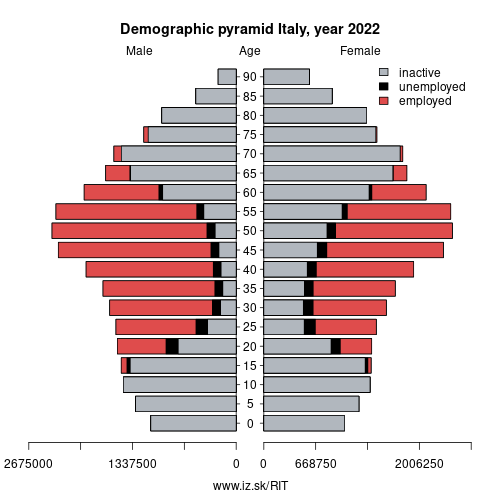
Composition of population according to age group, education and economic activity, Italy
| Age group | Low education | Middle education | High education |
|---|---|---|---|
| Y20-29 | P: 991.7 E: 444.7; U: 159.3; I: 387.7 | P: 3636.4 E: 1715.6; U: 321.5; I: 1599.3 | P: 1280.9 E: 687.0; U: 91.6; I: 502.3 |
| Y30-39 | P: 1743.0 E: 1021.5; U: 167.4; I: 554.1 | P: 3029.5 E: 2209.7; U: 211.5; I: 608.3 | P: 1802.9 E: 1537.4; U: 70.7; I: 194.8 |
| Y40-49 | P: 2830.2 E: 1755.4; U: 225.8; I: 849.0 | P: 3766.2 E: 2991.8; U: 174.7; I: 599.7 | P: 1807.3 E: 1618.8; U: 45.6; I: 142.9 |
| Y50-59 | P: 4384.7 E: 2518.9; U: 228.8; I: 1637.0 | P: 3705.8 E: 2881.2; U: 124.1; I: 700.5 | P: 1386.8 E: 1253.4; U: 24.5; I: 108.9 |
| Y60-69 | P: 4156.4 E: 817.6; U: 64.1; I: 3274.7 | P: 2535.6 E: 862.1; U: 32.6; I: 1640.9 | P: 864.1 E: 467.1; U: 6.1; I: 390.9 |
Note: in thousands in 2022, according to labour force sample survey. P – total population, E – employed, U – unemployed, I – number of ecnomically inactive
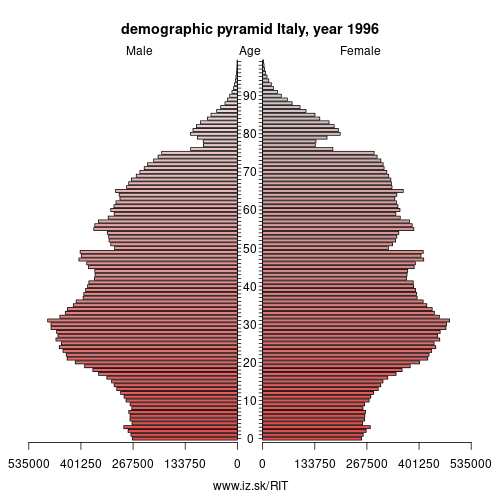
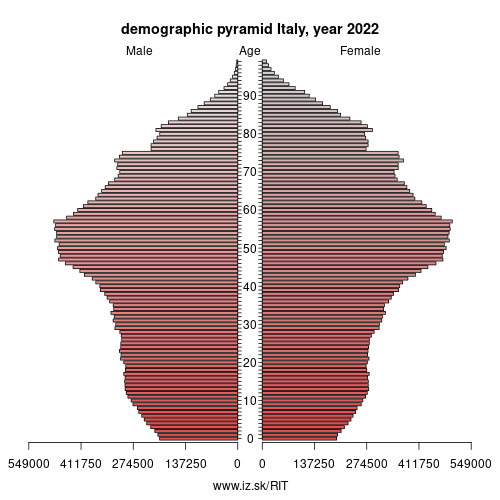
Demographics
| Indicator | Period | Value |
|---|---|---|
| Demographics | ||
| number of inhabitants | 2023 | 5.89972e+07 |
| population density | 2022 | 198.2 |
| old-age dependency ratio | 2023 | 37.8 |
| Population ageing | ||
| unemployment rate – over 55 years | 2023q4 | 4.5 |
| aggregate replacement ratio | 2022 | 0.74 |
| aggregate replacement ratio – females | 2022 | 0.69 |
| life expectancy of a 50 year old | 2021 | 33.9 |
| healty life expectancy at 50 years | 2021 | 21.8 |
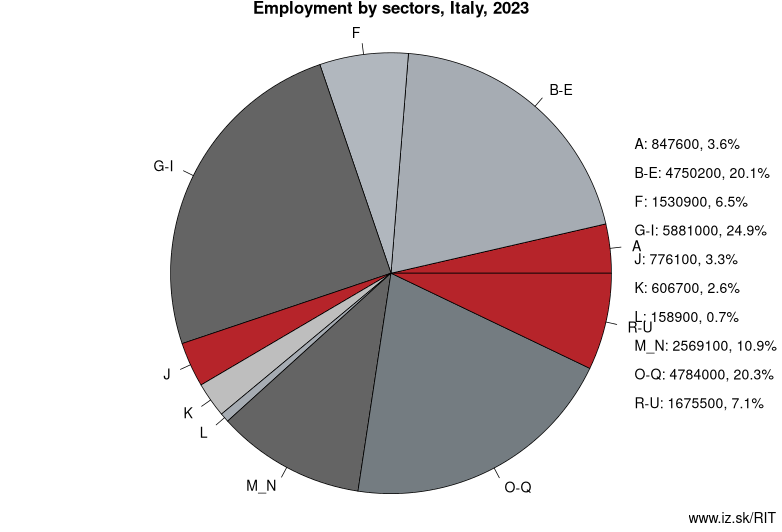
Employment by sectors, Italy
| NACE r2 | % | NACE r2 | % | ||
|---|---|---|---|---|---|
| A | 874.9 | 4 % | B-E | 4656.3 | 20 % |
| F | 1550.7 | 7 % | G-I | 5709.3 | 25 % |
| J | 688.5 | 3 % | K | 605.1 | 3 % |
| L | 156.1 | 1 % | M_N | 2519.7 | 11 % |
| O-Q | 4628.8 | 20 % | R-U | 1710 | 7 % |
| TOTAL | 23 099 | 100 % |
Data for the period year 2022. Source of the data is Eurostat, table [lfst_r_lfe2en2].
Italy (Italian: Italia [iˈtaːlja] (listen)), officially the Italian Republic (Italian: Repubblica Italiana [reˈpubblika itaˈljaːna]), is a European country consisting of a peninsula delimited by the Alps and surrounded by several islands. Located in the middle of the Mediterranean sea and traversed along its length by the Apennines, Italy has a largely temperate seasonal and Mediterranean climate. The country covers a total area of 301,340 km2 (116,350 sq mi), and land area of 294,140 km2 (113,570 sq mi), and shares open land borders with France, Slovenia, Austria, Switzerland and the enclaved microstates of Vatican City and San Marino. Italy has a territorial exclave in Switzerland (Campione) and a maritime exclave in the Tunisian Sea (Lampedusa). With around 60 million inhabitants, Italy is the fourth-most populous member state of the European Union.
Due to its central geographic location in Southern Europe and the Mediterranean, Italy has historically been home to myriad peoples and cultures. In addition to the various ancient peoples dispersed throughout modern-day Italy, the most predominant being the Indo-European Italic peoples who gave the peninsula its name, beginning from the classical era, Phoenicians and Carthaginians founded colonies mostly in insular Italy, Greeks established settlements in the so-called Magna Graecia of southern Italy, while Etruscans and Celts inhabited central and northern Italy respectively. An Italic tribe known as the Latins formed the Roman Kingdom in the 8th century BC, which eventually became a republic with a government of the Senate and the People. The Roman Republic initially conquered and assimilated its neighbours on the peninsula, eventually expanding and conquering parts of Europe, North Africa and Asia. By the first century BC, the Roman Empire emerged as the dominant power in the Mediterranean Basin and became the leading cultural, political and religious centre of Western civilisation, inaugurating the Pax Romana, a period of more than 200 years during which Italy's law, technology, economy, art, and literature developed.
Other: Iceland, Republic of Ireland, Italy
Neighbours: Austria, Slovenia, Switzerland, France
Subregions: Northwest Italy, South Italy, Insular Italy, Northeast Italy, Central Italy
Suggested citation: Michal Páleník: Europe and its regions in numbers - Italy – IT, IZ Bratislava, retrieved from: https://www.iz.sk/PIT, ISBN: 978-80-970204-9-1, DOI:10.5281/zenodo.10200164
 Share
Share Facebook
 Twitter
 News
News