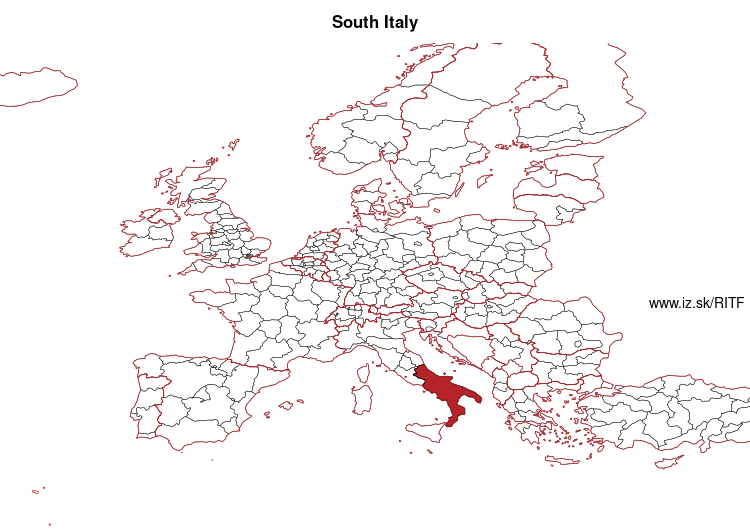
South Italy – ITF
EU regions: Italy > South Italy
| Indicator | Period | Value |
|---|---|---|
| Life long learning | ||
| life long learning participation | 2022 | 7.8 |
| Part time jobs and flexible employment | ||
| percentage of part time workers | 2022 | 16.32 |
| percentage of part time workers, men | 2022 | 9.08 |
| percentage of part time workers, women | 2022 | 28.92 |
| Gender differences | ||
| gender gap in employment rate | 2022 | 56.98 |
| gender gap in unemployment rate | 2022 | 137.7 |
| Graduates and young people | ||
| unemployment rate of youth with elementary education | 2022 | 46.6 |
| NEET | 2022 | 21.5 |
| Gross domestic product | ||
| GDP per capita in PPS of EU average | 2022 | 65 |
| Employment | ||
| employment rate | 2022 | 47.2 |
| Social exclusion | ||
| people at risk of poverty or social exclusion | 2020 | 40.7 |
More on wikipedia wikidata Q2250397 South Italy slovensky: ITF
Subregions: Abruzzo, Molise, Campania, Apulia, Basilicata, Calabria
Unemployment
| Indicator | Period | Value |
|---|---|---|
| Unemployment | ||
| unemployment rate | 2022 | 14.2 |
| youth unemployment rate | 2022 | 36 |
| Long term unemployment | ||
| long term unemployment | 2022 | 9.2 |
| share of long term unemployed | 2022 | 66 |
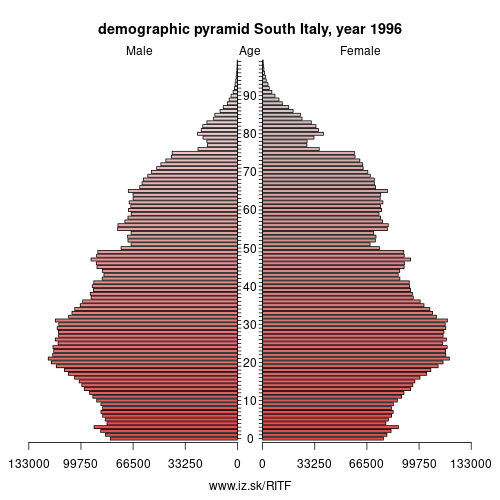
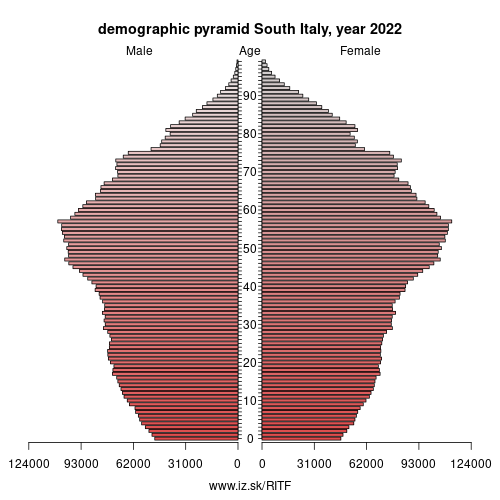
Demographics
| Indicator | Period | Value |
|---|---|---|
| Demographics | ||
| number of inhabitants | 2023 | 1.3464669e+07 |
| population density | 2022 | 183.8 |
| old-age dependency ratio | 2023 | 35.1 |
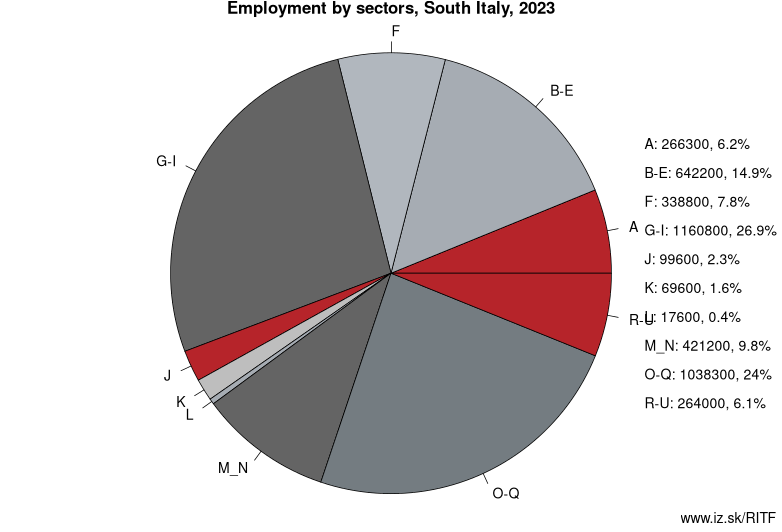
Employment by sectors, South Italy
| NACE r2 | % | NACE r2 | % | ||
|---|---|---|---|---|---|
| A | 283.9 | 7 % | B-E | 606.3 | 14 % |
| F | 338.8 | 8 % | G-I | 1127.2 | 27 % |
| J | 87.1 | 2 % | K | 74.5 | 2 % |
| L | 18.8 | 0 % | M_N | 412.6 | 10 % |
| O-Q | 993.1 | 24 % | R-U | 269.3 | 6 % |
| TOTAL | 4211.6 | 100 % |
Data for the period year 2022. Source of the data is Eurostat, table [lfst_r_lfe2en2].
Other: Italy, Insular Italy, Central Italy, Northwest Italy, South Italy, Northeast Italy
Neighbours: Central Italy
Subregions: Abruzzo, Molise, Campania, Apulia, Basilicata, Calabria
Suggested citation: Michal Páleník: Europe and its regions in numbers - South Italy – ITF, IZ Bratislava, retrieved from: https://www.iz.sk/PITF, ISBN: 978-80-970204-9-1, DOI:10.5281/zenodo.10200164
https://www.iz.sk/en/projects/eu-regions/ITF
 Share
Share Facebook
 Twitter
 News
News