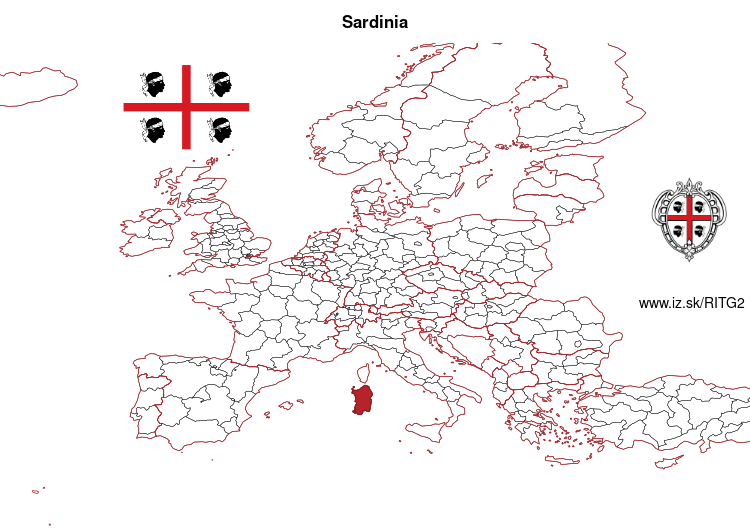
Autonomous Region of Sardinia – ITG2
EU regions: Italy > Insular Italy > Autonomous Region of Sardinia
| Indicator | Period | Value |
|---|---|---|
| Life long learning | ||
| life long learning participation | 2022 | 12.2 |
| Part time jobs and flexible employment | ||
| percentage of part time workers | 2022 | 22.79 |
| percentage of part time workers, men | 2022 | 12.28 |
| percentage of part time workers, women | 2022 | 37.1 |
| Gender differences | ||
| gender gap in employment rate | 2022 | 74.13 |
| gender gap in unemployment rate | 2022 | 130.39 |
| Graduates and young people | ||
| unemployment rate of youth with elementary education | 2022 | 33.9 |
| NEET | 2022 | 16 |
| Gross domestic product | ||
| GDP per capita in PPS of EU average | 2022 | 71 |
| Employment | ||
| employment rate | 2022 | 54.9 |
| Social exclusion | ||
| people at risk of poverty or social exclusion | 2020 | 33.8 |
wikidata Q56399088 Autonomous Region of Sardinia slovensky: ITG2
Subregions: Province of Sassari, Province of Nuoro, Province of Cagliari, Province of Oristano, Province of Olbia-Tempio, Province of Ogliastra, Province of Medio Campidano, Province of Carbonia-Iglesias
Unemployment
| Indicator | Period | Value |
|---|---|---|
| Unemployment | ||
| unemployment rate | 2022 | 11.8 |
| youth unemployment rate | 2022 | 27.4 |
| Long term unemployment | ||
| long term unemployment | 2022 | 6.2 |
| share of long term unemployed | 2022 | 53.9 |
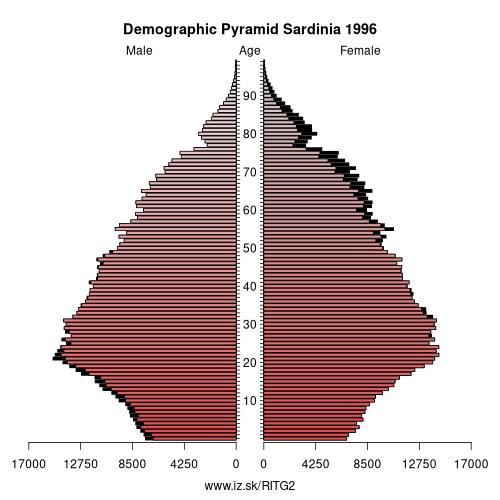
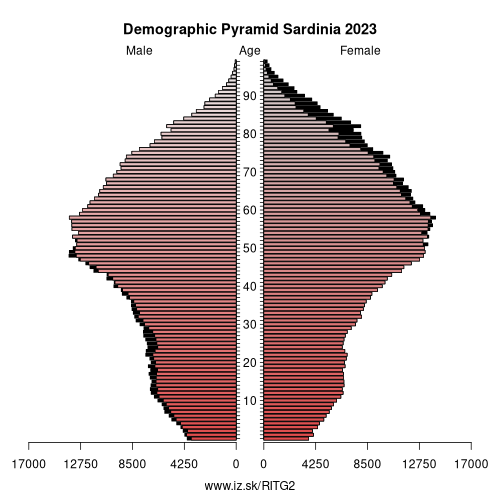
Demographics
| Indicator | Period | Value |
|---|---|---|
| Demographics | ||
| number of inhabitants | 2023 | 1.578146e+06 |
| population density | 2022 | 66.5 |
| old-age dependency ratio | 2023 | 41.4 |
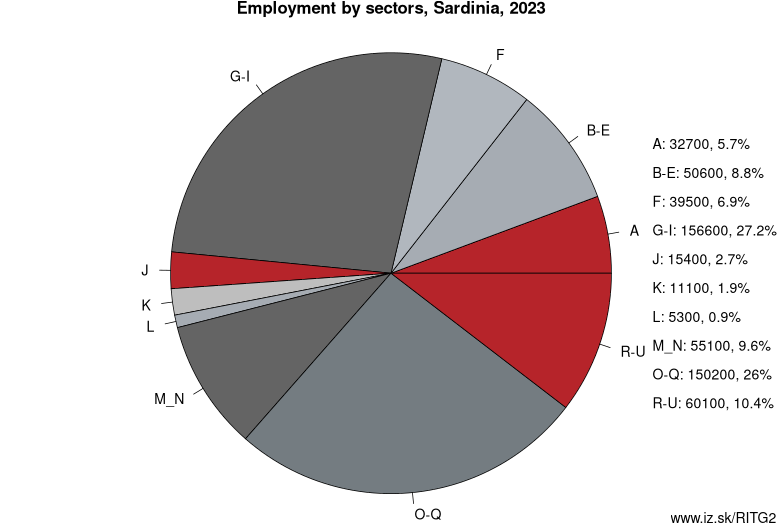
Employment by sectors, Autonomous Region of Sardinia
| NACE r2 | % | NACE r2 | % | ||
|---|---|---|---|---|---|
| A | 30.9 | 5 % | B-E | 56.9 | 10 % |
| F | 45 | 8 % | G-I | 151.6 | 27 % |
| J | 9.9 | 2 % | K | 8.7 | 2 % |
| L | 3.1 | 1 % | M_N | 53.1 | 9 % |
| O-Q | 153.7 | 27 % | R-U | 53.4 | 9 % |
| TOTAL | 566.2 | 100 % |
Data for the period year 2022. Source of the data is Eurostat, table [lfst_r_lfe2en2].
From Wikipedia :
Sardinia ( sar-DIN-ee-ə; Italian: Sardegna [sarˈdeɲɲa]; Sardinian: Sardìgna [saɾˈdiɲɲa] or Sardìnnia [saɾˈdinja]; Sassarese: Sardhigna; Gallurese: Saldigna; Algherese: Sardenya; Tabarchino: Sardegna) is the second-largest island in the Mediterranean Sea (after Sicily and before Cyprus). It is located west of the Italian Peninsula and to the immediate south of the French island of Corsica.Sardinia is politically a region of Italy. Its official name is Regione Autonoma della Sardegna (Sardinian: Regione Autònoma de Sardigna) (Autonomous Region of Sardinia), and enjoys some degree of domestic autonomy granted by a specific Statute. It is divided into four provinces and a metropolitan city, with Cagliari being the region's capital and also its largest city. Sardinia's indigenous language and the other minority languages (Sassarese, Corsican Gallurese, Algherese Catalan and Ligurian Tabarchino) spoken on the island are recognized by the regional law and enjoy „equal dignity" with Italian.
Due to the variety of its ecosystems, which include mountains, woods, plains, largely uninhabited territories, streams, rocky coasts and long sandy beaches, the island has been defined metaphorically as a micro-continent. In the modern era, many travelers and writers have extolled the beauty of its untouched landscape, which houses the vestiges of the Nuragic civilization.
Etymology
The name Sardinia is from the pre-Roman noun *s(a)rd-, later romanised as sardus (feminine sarda). It makes its first appearance on the Nora Stone, where the word Šrdn testifies to the name's existence when the Phoenician merchants first arrived. According to Timaeus, one of Plato's dialogues, Sardinia (referred to by most ancient Greek authors as „Sardò", Σαρδὼ) and its people as well might have been named after a legendary woman going by Sardò (Ancient Greek: Σαρδὼ), born in Sardis (Σάρδεις), capital of the ancient Kingdom of Lydia. There has also been speculation that identifies the ancient Nuragic Sards with the Sherden, one of the Sea Peoples.
Other: Insular Italy, Sicily, Autonomous Region of Sardinia
Subregions: Province of Sassari, Province of Nuoro, Province of Cagliari, Province of Oristano, Province of Olbia-Tempio, Province of Ogliastra, Province of Medio Campidano, Province of Carbonia-Iglesias
Suggested citation: Michal Páleník: Europe and its regions in numbers - Autonomous Region of Sardinia – ITG2, IZ Bratislava, retrieved from: https://www.iz.sk/PITG2, ISBN: 978-80-970204-9-1, DOI:10.5281/zenodo.10200164
 Share
Share Facebook
 Twitter
 News
News