Lithuania – LT0
EU regions: Lithuania > Lithuania
| Indicator | Period | Value |
|---|---|---|
| Life long learning | ||
| life long learning participation | 2022 | 8.5 |
| Part time jobs and flexible employment | ||
| percentage of part time workers | 2022 | 6.29 |
| percentage of part time workers, men | 2022 | 4.22 |
| percentage of part time workers, women | 2022 | 8.25 |
| Gender differences | ||
| gender gap in employment rate | 2022 | 99.59 |
| gender gap in unemployment rate | 2022 | 85.94 |
| Graduates and young people | ||
| unemployment rate of youth with elementary education | 2022 | 16.6 |
| NEET | 2022 | 9.7 |
| Gross domestic product | ||
| GDP per capita in PPS of EU average | 2022 | 89 |
| Employment | ||
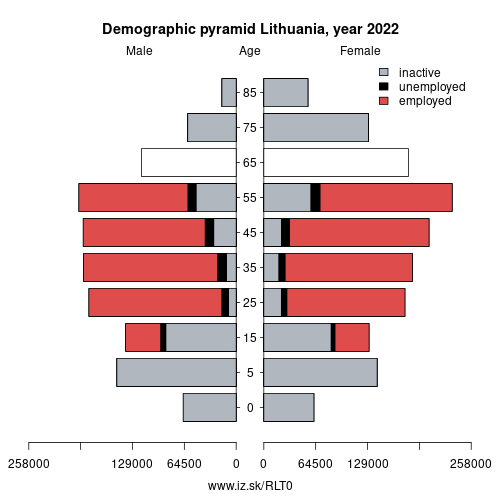
| employment rate | 2022 | 73.8 |
More on wikipedia wikidata Q37 on OpenStreetMap Lithuania slovensky: LT0
Subregions: Capital Region, Central and Western Lithuania region
Unemployment
| Indicator | Period | Value |
|---|---|---|
| Unemployment | ||
| unemployment rate | 2022 | 6.2 |
| youth unemployment rate | 2022 | 11.9 |
| Long term unemployment | ||
| long term unemployment | 2022 | 2.3 |
| share of long term unemployed | 2022 | 38.9 |
Demographics
| Indicator | Period | Value |
|---|---|---|
| Demographics | ||
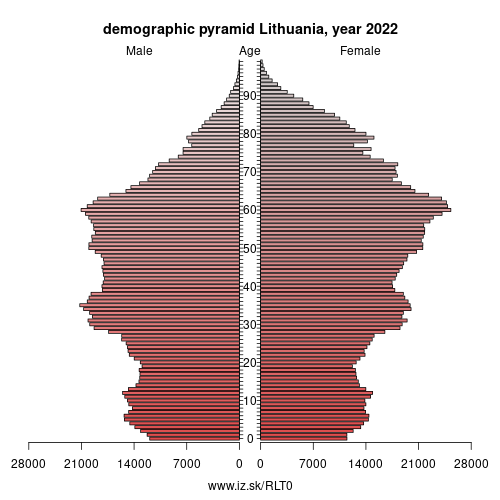
| number of inhabitants | 2023 | 2.857279e+06 |
| population density | 2022 | 45.2 |
| old-age dependency ratio | 2023 | 30.8 |
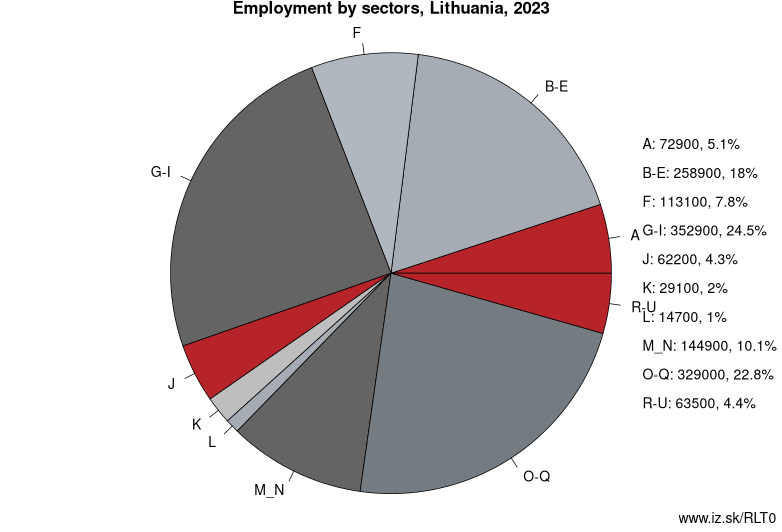
Employment by sectors, Lithuania
| NACE r2 | % | NACE r2 | % | ||
|---|---|---|---|---|---|
| A | 77.5 | 5 % | B-E | 254.4 | 18 % |
| F | 111.2 | 8 % | G-I | 348.6 | 25 % |
| J | 57.1 | 4 % | K | 31 | 2 % |
| L | 15.2 | 1 % | M_N | 128.9 | 9 % |
| O-Q | 328.7 | 23 % | R-U | 68.3 | 5 % |
| TOTAL | 1420.8 | 100 % |
Data for the period year 2022. Source of the data is Eurostat, table [lfst_r_lfe2en2].
Lithuania ( (listen) LITH-ew-AY-nee-ə; Lithuanian: Lietuva [lʲɪɛtʊˈvɐ]), officially the Republic of Lithuania (Lithuanian: Lietuvos Respublika), is a country in the Baltic region of Europe. Lithuania is considered to be one of the Baltic states. It is situated along the southeastern shore of the Baltic Sea, to the east of Sweden and Denmark. It is bordered by Latvia to the north, Belarus to the east and south, Poland to the south, and Kaliningrad Oblast (a Russian exclave) to the southwest. Lithuania has an estimated population of 2.8 million people as of 2019, and its capital and largest city is Vilnius. Other major cities are Kaunas and Klaipėda. Lithuanians are Baltic people. The official language, Lithuanian, is one of only two living languages in the Baltic branch of the Indo-European language family, the other being Latvian.
For centuries, the southeastern shores of the Baltic Sea were inhabited by various Baltic tribes. In the 1230s, the Lithuanian lands were united by Mindaugas and the Kingdom of Lithuania was created on 6 July 1253.
Neighbours: MAKROREGION WSCHODNI, Makroregion północny, Latvia
Subregions: Capital Region, Central and Western Lithuania region
Suggested citation: Michal Páleník: Europe and its regions in numbers - Lithuania – LT0, IZ Bratislava, retrieved from: https://www.iz.sk/PLT0, ISBN: 978-80-970204-9-1, DOI:10.5281/zenodo.10200164
 Share
Share Facebook
 Twitter
 News
News