Malta – MT
More on wikipedia wikidata Q233 on OpenStreetMap Malta slovensky: MT
Unemployment
| Indicator | Period | Value |
|---|---|---|
| Unemployment | ||
| unemployment rate | 2023q4 | 2.9 |
| youth unemployment rate | 2023q4 | 8.4 |
| unemployment rate of low educated people | 2023q4 | 4.1 |
| Long term unemployment | ||
| long term unemployment | 2023q4 | 0.6 |
| share of long term unemployed | 2022 | 34.2 |
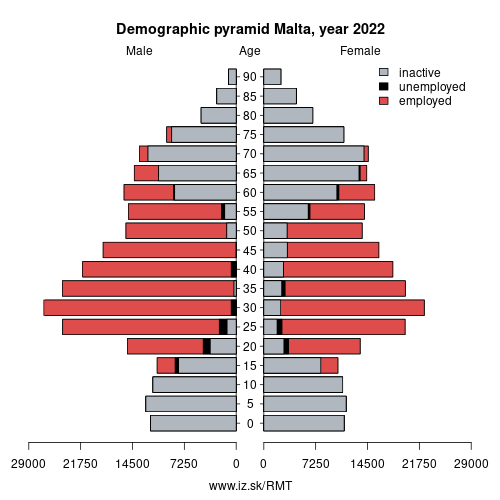
Composition of population according to age group, education and economic activity, Malta
| Age group | Low education | Middle education | High education |
|---|---|---|---|
| Y20-29 | P: 11.4 E: 8.4; U: 1.5; I: 1.5 | P: 36.9 E: 29.9; U: 1.5; I: 5.5 | P: 26.3 E: 23.0; U: 1.0; I: 2.3 |
| Y30-39 | P: 23.0 E: 18.3; U: 0.9; I: 3.8 | P: 36.1 E: 32.0; U: 1.0; I: 3.1 | P: 38.6 E: 36.2; U: 0.6; I: 1.8 |
| Y40-49 | P: 28.4 E: 22.4; U: 0.5; I: 5.5 | P: 24.3 E: 22.2; U: 0.2; I: 1.9 | P: 25.7 E: 23.9; U: 0.7; I: 1.1 |
| Y50-59 | P: 27.7 E: 18.0; U: 0.4; I: 9.3 | P: 18.7 E: 16.2; U: 0.4; I: 2.1 | P: 12.5 E: 10.3; U: 0.6; I: 1.6 |
| Y60-69 | P: 39.8 E: 7.8; U: 0.0; I: 32.0 | P: 13.0 E: 5.5; U: 0.0; I: 7.5 | P: 6.3 E: 2.6; U: 0.0; I: 3.7 |
Note: in thousands in 2022, according to labour force sample survey. P – total population, E – employed, U – unemployed, I – number of ecnomically inactive
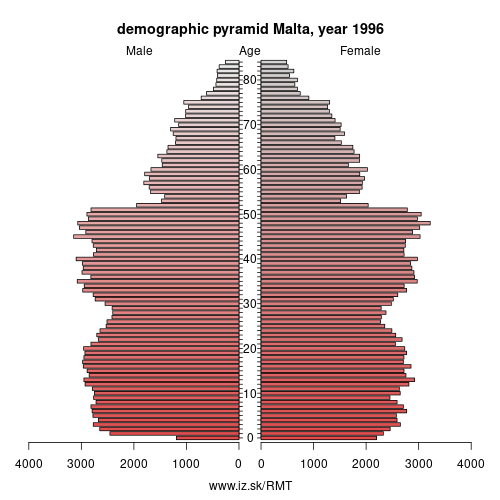
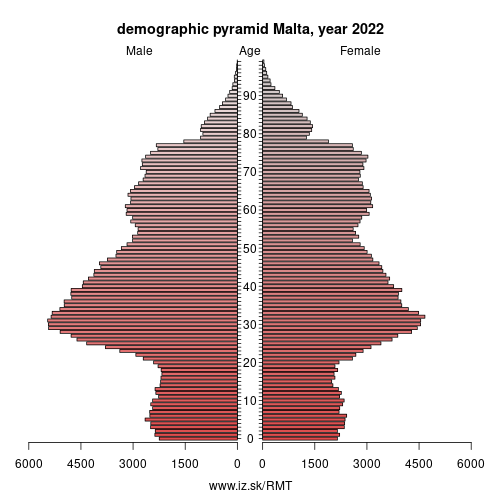
Demographics
| Indicator | Period | Value |
|---|---|---|
| Demographics | ||
| number of inhabitants | 2023 | 542 051 |
| population density | 2022 | 1692.7 |
| old-age dependency ratio | 2023 | 27.1 |
| Population ageing | ||
| unemployment rate – over 55 years | 2021q3 | 5.3 |
| aggregate replacement ratio | 2022 | 0.53 |
| aggregate replacement ratio – females | 2022 | 0.45 |
| life expectancy of a 50 year old | 2021 | 33.9 |
| healty life expectancy at 50 years | 2021 | 22.7 |
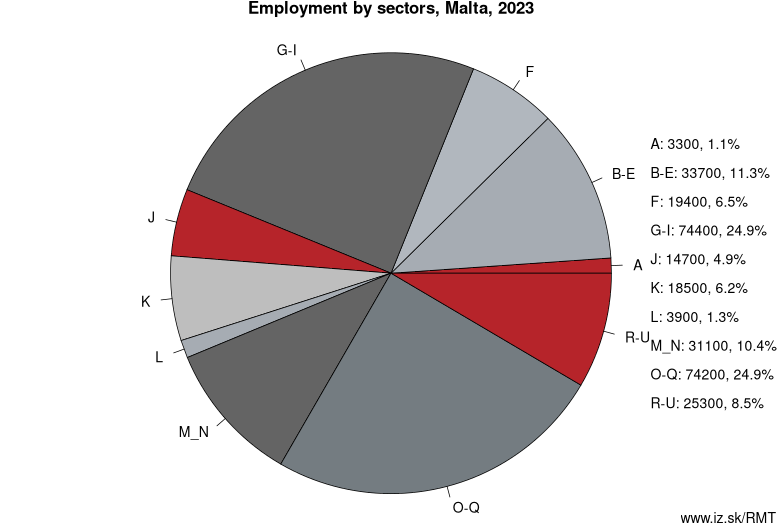
Employment by sectors, Malta
| NACE r2 | % | NACE r2 | % | ||
|---|---|---|---|---|---|
| A | 2.3 | 1 % | B-E | 31.5 | 11 % |
| F | 18.4 | 6 % | G-I | 68.7 | 24 % |
| J | 12.7 | 4 % | K | 17.6 | 6 % |
| L | 3.7 | 1 % | M_N | 31.6 | 11 % |
| O-Q | 71.8 | 25 % | R-U | 25.6 | 9 % |
| TOTAL | 284.1 | 100 % |
Data for the period year 2022. Source of the data is Eurostat, table [lfst_r_lfe2en2].
Malta (, (listen); Maltese: [ˈmɐltɐ]), officially known as the Republic of Malta (Maltese: Repubblika ta' Malta), is a Southern European island country consisting of an archipelago in the Mediterranean Sea. It lies 80 km (50 mi) south of Italy, 284 km (176 mi) east of Tunisia, and 333 km (207 mi) north of Libya. With a population of about 475,000 over an area of 316 km2 (122 sq mi), Malta is the world's tenth smallest and fifth most densely populated country. Its capital is Valletta, which is the smallest national capital in the European Union by area at 0.8 km². The official languages are Maltese and English, with Maltese officially recognised as the national language and the only Semitic language in the European Union.
Malta has been inhabited since approximately 5900 BC. Its location in the centre of the Mediterranean has historically given it great strategic importance as a naval base, with a succession of powers having contested and ruled the islands, including the Phoenicians and Carthaginians, Romans, Greeks, Arabs, Normans, Aragonese, Knights of St. John, French, and British. Most of these foreign influences have left some sort of mark on the country's ancient culture.
Malta became a British colony in 1815, serving as a way station for ships and the headquarters for the British Mediterranean Fleet. It played an important role in the Allied war effort during the Second World War, and was subsequently awarded the George Cross for its bravery in the face of an Axis siege, The British Parliament passed the Malta Independence Act in 1964, giving Malta independence from the United Kingdom as the State of Malta, with Queen Elizabeth II as its head of state and queen.
Other: Montenegro, Malta, North Macedonia
Suggested citation: Michal Páleník: Europe and its regions in numbers - Malta – MT, IZ Bratislava, retrieved from: https://www.iz.sk/PMT, ISBN: 978-80-970204-9-1, DOI:10.5281/zenodo.10200164
 Share
Share Facebook
 Twitter
 News
News