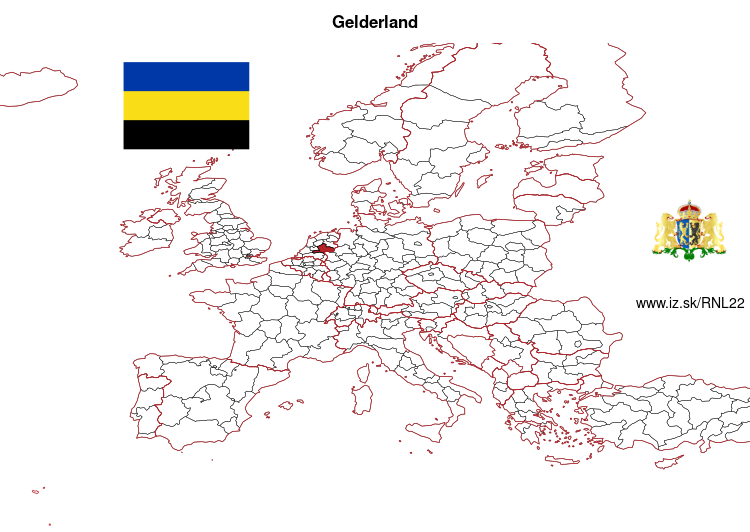
Gelderland – NL22
EU regions: Netherlands > Eastern Netherlands > Gelderland
| Indicator | Period | Value |
|---|---|---|
| Life long learning | ||
| life long learning participation | 2022 | 25.6 |
| Part time jobs and flexible employment | ||
| percentage of part time workers | 2022 | 41.15 |
| percentage of part time workers, men | 2022 | 19.73 |
| percentage of part time workers, women | 2022 | 65.52 |
| Gender differences | ||
| gender gap in employment rate | 2022 | 91.5 |
| gender gap in unemployment rate | 2022 | 97.22 |
| Graduates and young people | ||
| unemployment rate of youth with elementary education | 2022 | 11.5 |
| NEET | 2022 | 3.1 |
| Gross domestic product | ||
| GDP per capita in PPS of EU average | 2022 | 108 |
| Employment | ||
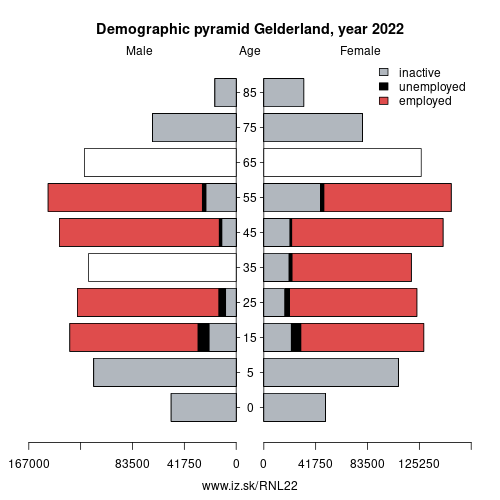
| employment rate | 2022 | 82.2 |
| Social exclusion | ||
| people at risk of poverty or social exclusion | 2020 | 14.6 |
More on wikipedia wikidata Q775 on OpenStreetMap Gelderland slovensky: NL22
Subregions: Veluwe, Zuidwest-Gelderland, Achterhoek, Arnhem/Nijmegen
Unemployment
| Indicator | Period | Value |
|---|---|---|
| Unemployment | ||
| unemployment rate | 2022 | 3.5 |
| youth unemployment rate | 2022 | 7.6 |
| Long term unemployment | ||
| long term unemployment | 2022 | 0.7 |
| share of long term unemployed | 2022 | 18.5 |
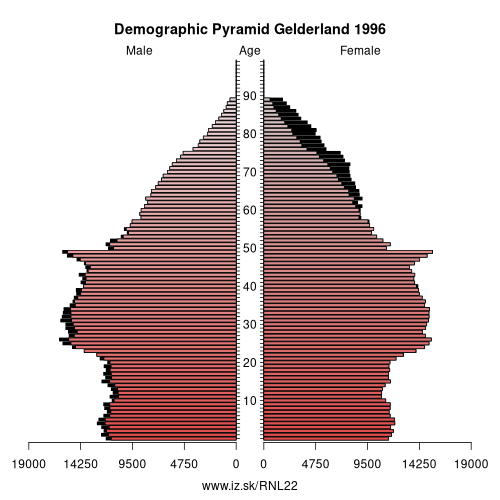
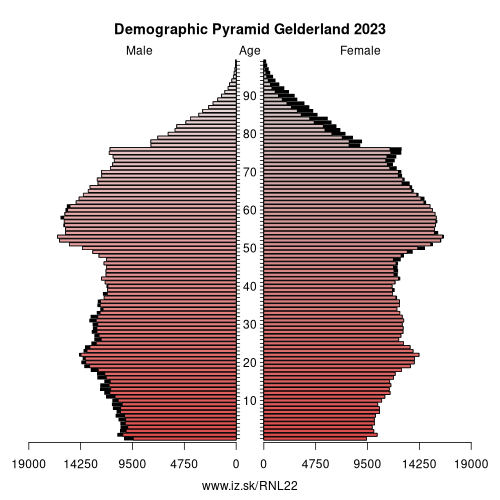
Demographics
| Indicator | Period | Value |
|---|---|---|
| Demographics | ||
| number of inhabitants | 2023 | 2.133708e+06 |
| population density | 2022 | 424.3 |
| old-age dependency ratio | 2023 | 33.6 |
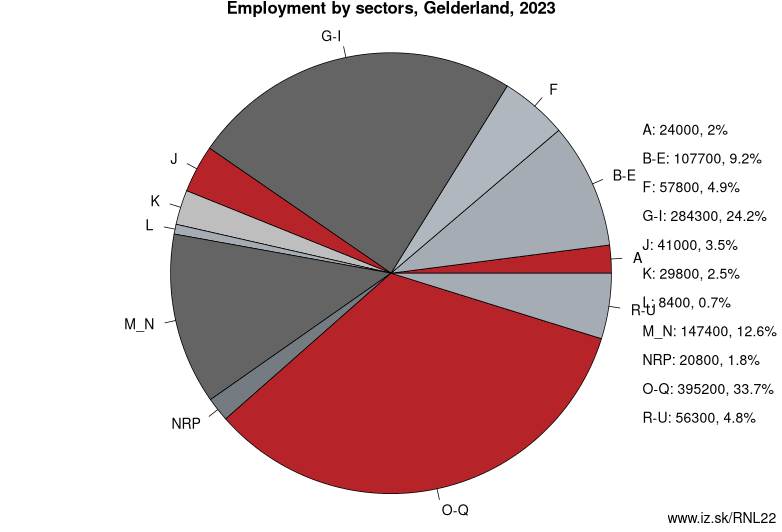
Employment by sectors, Gelderland
| NACE r2 | % | NACE r2 | % | ||
|---|---|---|---|---|---|
| A | 24.3 | 2 % | B-E | 110.3 | 10 % |
| F | 56.3 | 5 % | G-I | 277.9 | 24 % |
| J | 42.7 | 4 % | K | 25.8 | 2 % |
| L | 8.8 | 1 % | M_N | 146.8 | 13 % |
| NRP | 21.2 | 2 % | O-Q | 389.4 | 34 % |
| R-U | 52.1 | 5 % | TOTAL | 1155.6 | 100 % |
Data for the period year 2022. Source of the data is Eurostat, table [lfst_r_lfe2en2].
Gelderland (, also US: , Dutch: [ˈɣɛldərlɑnt] (listen)), also known as Guelders () in English, is a province of the Netherlands, located in the central eastern part of the country. With a land area of nearly 5,000 km2, it is the largest province of the Netherlands and shares borders with six other provinces (Flevoland, Limburg, North Brabant, Overijssel, South Holland and Utrecht) and Germany (North Rhine-Westphalia).
The capital is Arnhem (pop. 156,000); however, Nijmegen (pop. 175,000) and Apeldoorn (pop. nearly 161,000) are both larger municipalities (2017 figures). Other major regional centres in Gelderland are Ede, Doetinchem, Zutphen, Harderwijk, Tiel, Wageningen, Zevenaar, and Winterswijk. Gelderland had a population of just over two million in 2018.
History
Historically, the province dates from states of the Holy Roman Empire and takes its name from the nearby German city of Geldern. According to the Wichard saga, the city was named by the Lords of Pont who fought and killed a dragon in 878 AD. They named the town they founded after the death rattle of the dragon: "Gelre!"
The County of Guelders arose out of the Frankish pagus Hamaland in the 11th century around castles near Roermond and Geldern. The counts of Gelre acquired the Betuwe and Veluwe regions and, through marriage, the County of Zutphen.
Other: Eastern Netherlands, Overijssel, Gelderland, Flevoland
Neighbours: Overijssel, North Brabant, Flevoland, Utrecht, Düsseldorf Government Region, Münster Government Region, South Holland, Limburg
Subregions: Veluwe, Zuidwest-Gelderland, Achterhoek, Arnhem/Nijmegen
Suggested citation: Michal Páleník: Europe and its regions in numbers - Gelderland – NL22, IZ Bratislava, retrieved from: https://www.iz.sk/PNL22, ISBN: 978-80-970204-9-1, DOI:10.5281/zenodo.10200164
 Share
Share Facebook
 Twitter
 News
News