Flevoland – NL23
EU regions: Netherlands > Eastern Netherlands > Flevoland
| Indicator | Period | Value |
|---|---|---|
| Life long learning | ||
| life long learning participation | 2025 | 25.6 |
| Part time jobs and flexible employment | ||
| percentage of part time workers | 2025 | 33.12 |
| percentage of part time workers, men | 2025 | 14.95 |
| percentage of part time workers, women | 2025 | 55.31 |
| Gender differences | ||
| gender gap in employment rate | 2025 | 90.08 |
| gender gap in unemployment rate | 2025 | 105.56 |
| Graduates and young people | ||
| unemployment rate of youth with elementary education | 2025 | 10.6 |
| NEET | 2025 | 4.9 |
| Gross domestic product | ||
| GDP per capita in PPS of EU average | 2024 | 103 |
| Employment | ||
| employment rate | 2025 | 83.4 |
| Social exclusion | ||
| people at risk of poverty or social exclusion | 2020 | 13.9 |
Flevoland slovensky: NL23
Subregions: Flevoland
Unemployment
| Indicator | Period | Value |
|---|---|---|
| Unemployment | ||
| unemployment rate | 2025 | 3.7 |
| youth unemployment rate | 2025 | 8.1 |
| Long term unemployment | ||
| long term unemployment | 2024 | 0.7 |
| share of long term unemployed | 2024 | 18.6 |
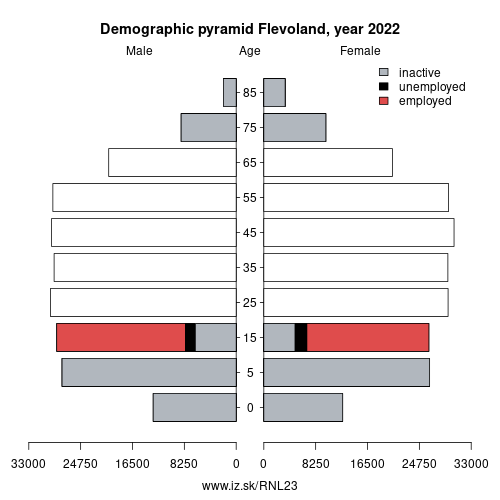
Demographics

| Indicator | Period | Value |
|---|---|---|
| Demographics | ||
| number of inhabitants | 2025 | 456 395 |
| population density | 2024 | 316.1 |
| old-age dependency ratio | 2025 | 24 |
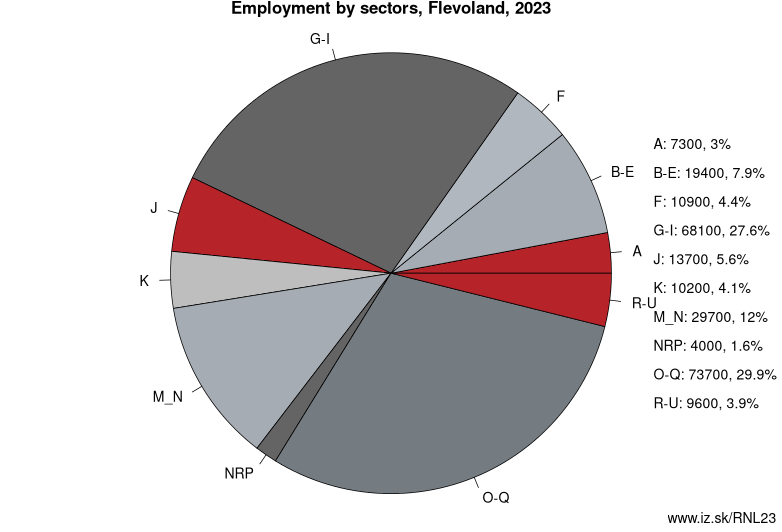
Employment by sectors, Flevoland
| NACE r2 | % | NACE r2 | % | ||
|---|---|---|---|---|---|
| A | 5.9 | 2% | B-E | 22 | 8% |
| F | 9.3 | 4% | G-I | 59.9 | 23% |
| J | 15 | 6% | K | 9.2 | 4% |
| L | 1.7 | 1% | M_N | 33.8 | 13% |
| NRP | 6.8 | 3% | O-Q | 84.1 | 32% |
| R-U | 11.2 | 4% | TOTAL | 258.9 | 100% |
Data for the period year 2025. Source of the data is Eurostat, table [lfst_r_lfe2en2].
From Wikipedia :
Flevoland (UK: , US: , Dutch: [ˈfleːvoːlɑnt] (listen)) is the 12th and last province of the Netherlands, established on 1 January 1986, when the southern and eastern Flevopolders were merged into one provincial entity. It is located in the centre of the country, where the former Zuiderzee was. Almost all of the land belonging to Flevoland was reclaimed only in the 1950s and 1960s. The province has about 407,905 inhabitants (2016) and consists of six municipalities. Its capital is Lelystad and most populous city is Almere.Flevoland is bordered in the extreme north by Friesland, in the northeast by Overijssel, and in the northwest by the lakes Markermeer and the IJsselmeer. In the southeast, the province borders on Gelderland, and in the southwest on Utrecht and North Holland.
Etymology
Flevoland was named after Lacus Flevo, a name recorded in Roman sources for a large inland lake at the southern end of the later-formed Zuiderzee; it was mentioned by the Roman geographer Pomponius Mela in his De Chorographia in 44 AD. Due to the slowly rising sea level, a number of lakes gradually developed in the Zuiderzee region, which eventually became contiguous. Pomponius wrote about this: „The northern branch of the Rhine extends to Lake Flevo, which encloses an island of the same name and then flows to the sea like a normal river." Other sources speak of Flevum, which means 'flow'. The process continued and gradually the Zuiderzee arose from this lake.
Other: Eastern Netherlands, Gelderland, Overijssel, Flevoland
Neighbours: Utrecht, North Holland, Overijssel, Friesland, Gelderland
Subregions: Flevoland
Suggested citation: Michal Páleník: Europe and its regions in numbers - Flevoland – NL23, IZ Bratislava, retrieved from: https://www.iz.sk/PNL23, ISBN: 978-80-970204-9-1, DOI:10.5281/zenodo.10200164
 Share
Share Facebook
 Twitter
 News
News