South Holland – NL33
EU regions: Netherlands > Western Netherlands > South Holland
| Indicator | Period | Value |
|---|---|---|
| Life long learning | ||
| life long learning participation | 2022 | 27.3 |
| Part time jobs and flexible employment | ||
| percentage of part time workers | 2022 | 34.46 |
| percentage of part time workers, men | 2022 | 15.16 |
| percentage of part time workers, women | 2022 | 56.32 |
| Gender differences | ||
| gender gap in employment rate | 2022 | 91.65 |
| gender gap in unemployment rate | 2022 | 119.44 |
| Graduates and young people | ||
| unemployment rate of youth with elementary education | 2022 | 11 |
| NEET | 2022 | 2.4 |
| Gross domestic product | ||
| GDP per capita in PPS of EU average | 2022 | 127 |
| Employment | ||
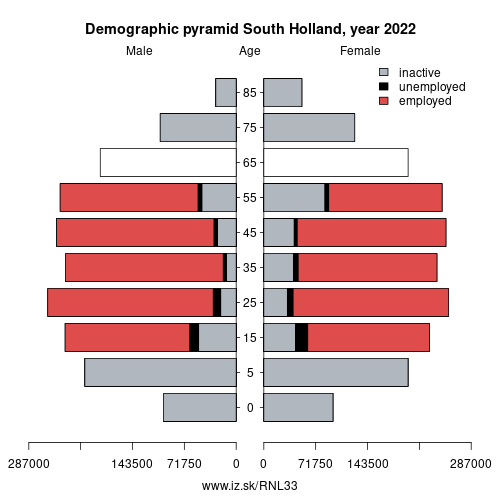
| employment rate | 2022 | 80.3 |
| Social exclusion | ||
| people at risk of poverty or social exclusion | 2020 | 18.1 |
South Holland slovensky: NL33
Subregions: Agglomeratie's-Gravenhage, Delft en Westland, Agglomeratie Leiden en Bollenstreek, Zuidoost-Zuid-Holland, Oost-Zuid-Holland, Groot-Rijnmond
Unemployment
| Indicator | Period | Value |
|---|---|---|
| Unemployment | ||
| unemployment rate | 2022 | 4 |
| youth unemployment rate | 2022 | 7.8 |
| Long term unemployment | ||
| long term unemployment | 2022 | 0.8 |
| share of long term unemployed | 2022 | 19.9 |
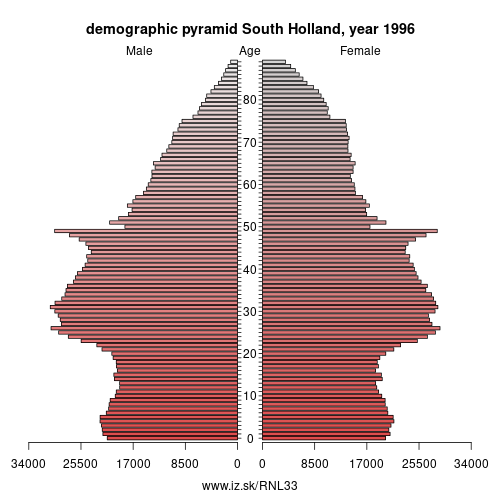
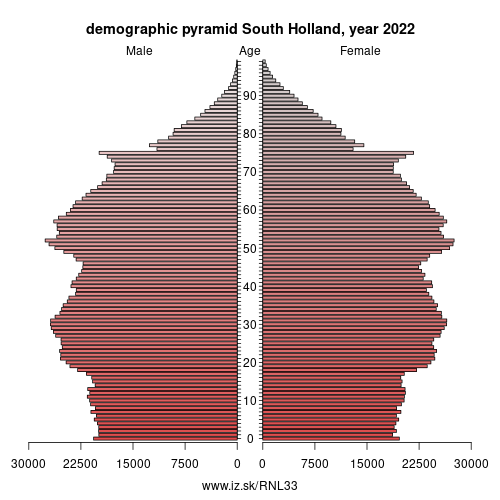
Demographics
| Indicator | Period | Value |
|---|---|---|
| Demographics | ||
| number of inhabitants | 2023 | 3.804906e+06 |
| population density | 2022 | 1310.9 |
| old-age dependency ratio | 2023 | 28.7 |
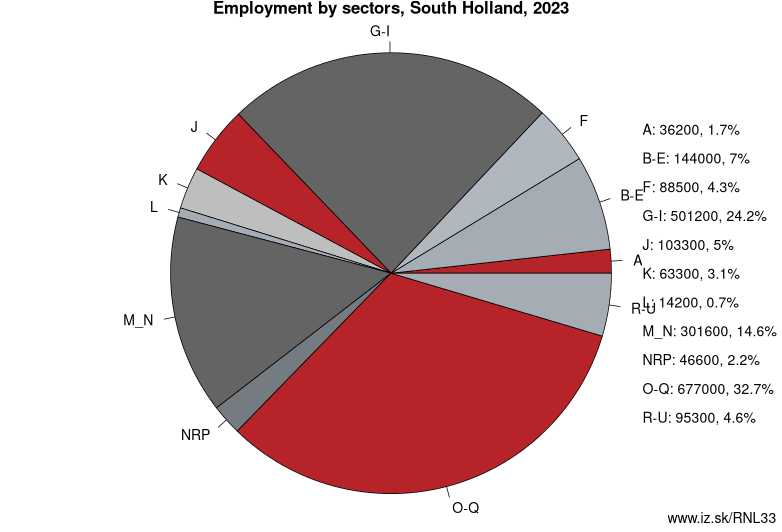
Employment by sectors, South Holland
| NACE r2 | % | NACE r2 | % | ||
|---|---|---|---|---|---|
| A | 31.9 | 2 % | B-E | 142.9 | 7 % |
| F | 83.5 | 4 % | G-I | 483.3 | 24 % |
| J | 99 | 5 % | K | 61.5 | 3 % |
| L | 16.2 | 1 % | M_N | 305.1 | 15 % |
| NRP | 49.5 | 2 % | O-Q | 651.3 | 32 % |
| R-U | 92.6 | 5 % | TOTAL | 2016.7 | 100 % |
Data for the period year 2022. Source of the data is Eurostat, table [lfst_r_lfe2en2].
Other: Western Netherlands, Utrecht, North Holland, South Holland, Zeeland
Neighbours: Utrecht, North Holland, North Brabant, Zeeland, Gelderland
Subregions: Agglomeratie's-Gravenhage, Delft en Westland, Agglomeratie Leiden en Bollenstreek, Zuidoost-Zuid-Holland, Oost-Zuid-Holland, Groot-Rijnmond
Suggested citation: Michal Páleník: Europe and its regions in numbers - South Holland – NL33, IZ Bratislava, retrieved from: https://www.iz.sk/PNL33, ISBN: 978-80-970204-9-1, DOI:10.5281/zenodo.10200164
 Share
Share Facebook
 Twitter
 News
News