Poland – PL
More on wikipedia wikidata Q36 on OpenStreetMap Poland slovensky: PL
Subregions: MAKROREGION POŁUDNIOWY, MAKROREGION PÓŁNOCNO-ZACHODNI, MAKROREGION POŁUDNIOWO-ZACHODNI, Makroregion północny, MAKROREGION CENTRALNY, MAKROREGION WSCHODNI, MAKROREGION WOJEWÓDZTWO MAZOWIECKIE
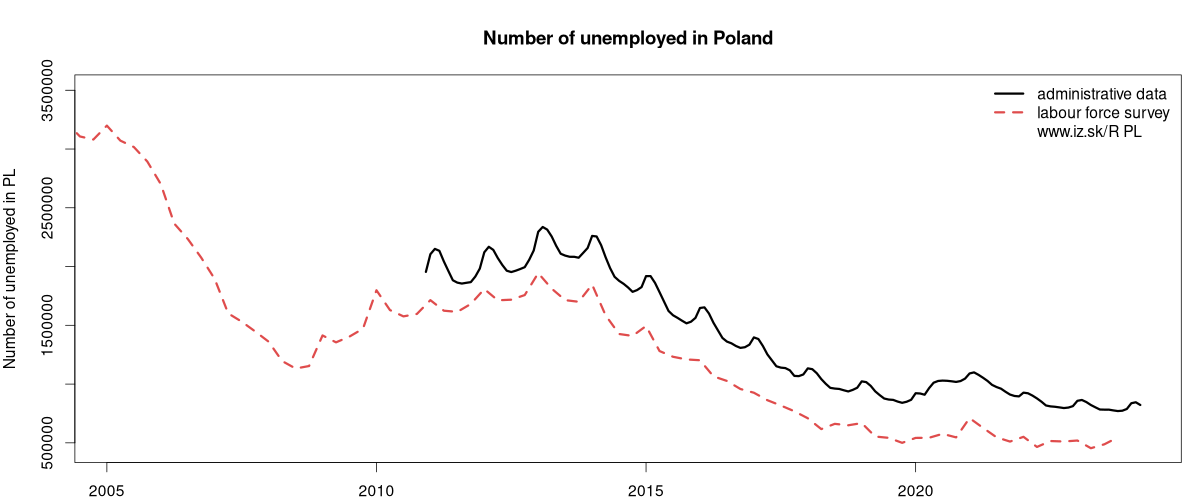
Unemployment
| Indicator | Period | Value |
|---|---|---|
| Unemployment | ||
| unemployment rate | 2022 | 2.9 |
| youth unemployment rate | 2022 | 10.8 |
| unemployment rate of low educated people | 2023q4 | 7.8 |
| Long term unemployment | ||
| long term unemployment | 2023q4 | 0.9 |
| share of long term unemployed | 2023q4 | 28.3 |
| Unemployment according to labour offices | ||
| number of registered unemployed | February 2024 | 845 255 |
| number of unemployed women | February 2024 | 439 711 |
| number of long-term unemployed | February 2024 | 307 095 |
Comparisson of unemployment according to ILO methodology and registered unemployment yeilds some differences.
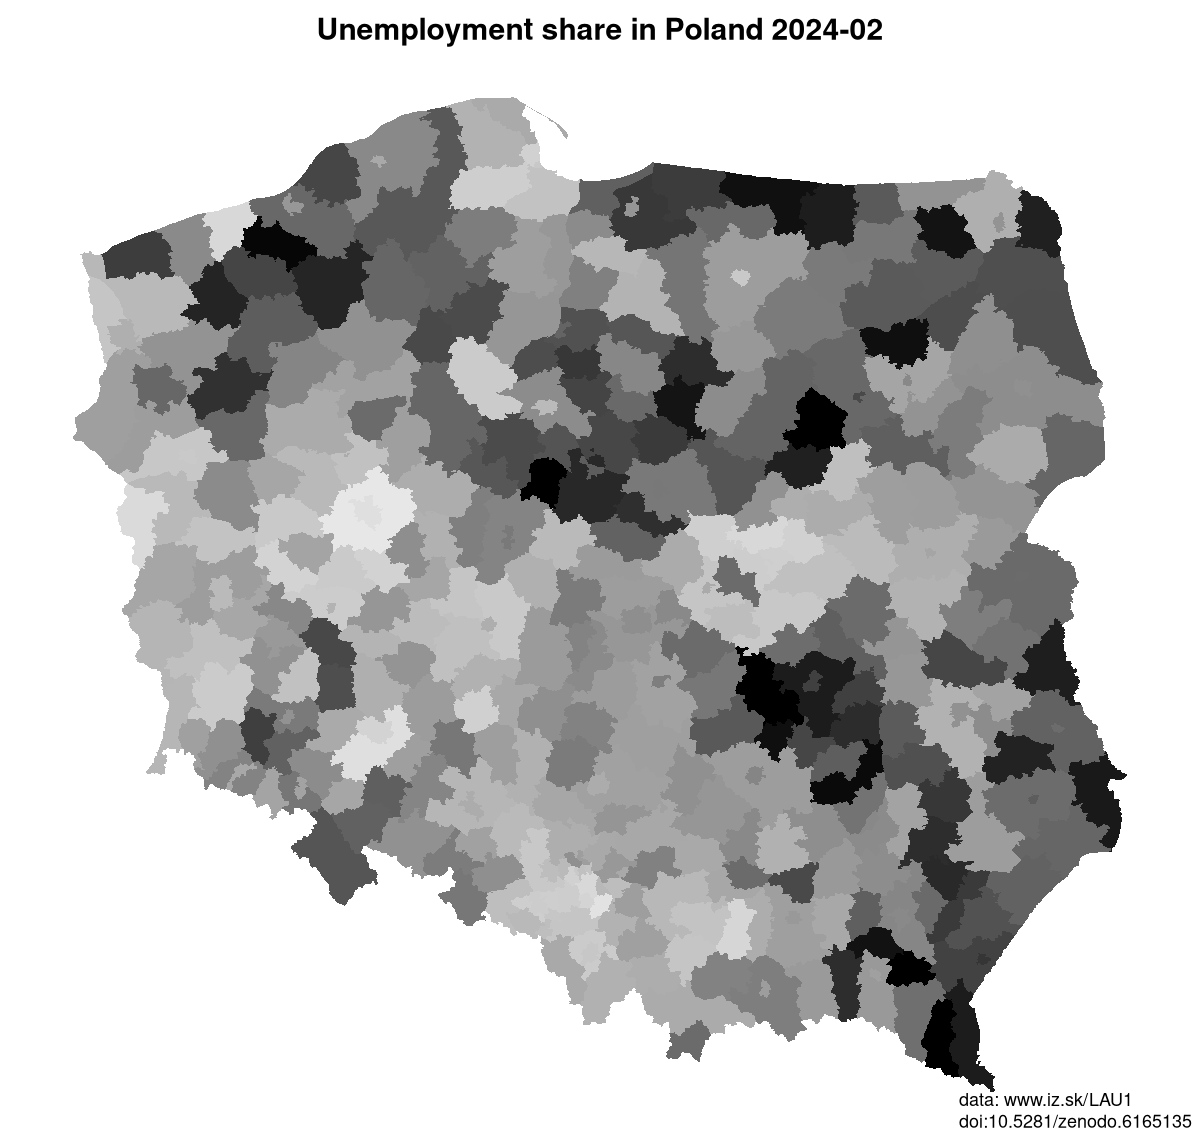
Data on unemployment in counties of Poland are available at Local Administrative Units data of Visegrad countries.
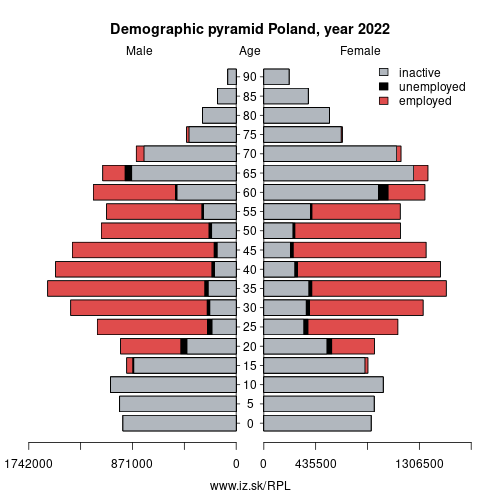
Composition of population according to age group, education and economic activity, Poland
| Age group | Low education | Middle education | High education |
|---|---|---|---|
| Y20-29 | P: 299.6 E: 113.5; U: 20.4; I: 165.7 | P: 2604.2 E: 1728.1; U: 124.2; I: 751.9 | P: 852.6 E: 699.9; U: 27.2; I: 125.5 |
| Y30-39 | P: 267.9 E: 134.1; U: 14.4; I: 119.4 | P: 2497.2 E: 2075.0; U: 70.3; I: 351.9 | P: 2485.4 E: 2335.7; U: 27.0; I: 122.7 |
| Y40-49 | P: 276.6 E: 157.3; U: 13.2; I: 106.1 | P: 3093.1 E: 2651.5; U: 67.5; I: 374.1 | P: 2107.4 E: 2005.7; U: 22.2; I: 79.5 |
| Y50-59 | P: 351.1 E: 200.3; U: 10.2; I: 140.6 | P: 2991.4 E: 2271.7; U: 55.1; I: 664.6 | P: 938.9 E: 857.0; U: 6.3; I: 75.6 |
| Y60-69 | P: 606.4 E: 85.4; U: 3.0; I: 518.0 | P: 3533.5 E: 902.3; U: 15.2; I: 2616.0 | P: 766.0 E: 316.2; U: 2.2; I: 447.6 |
Note: in thousands in 2022, according to labour force sample survey. P – total population, E – employed, U – unemployed, I – number of ecnomically inactive
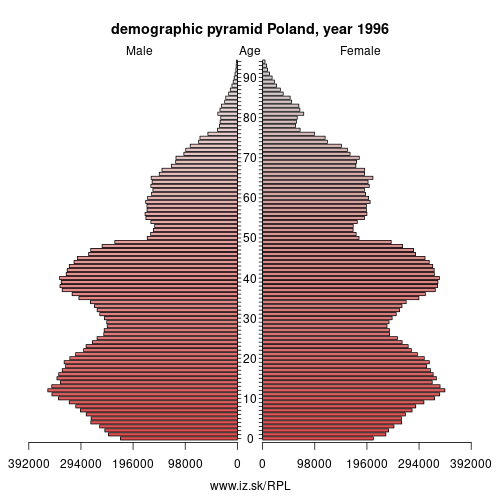
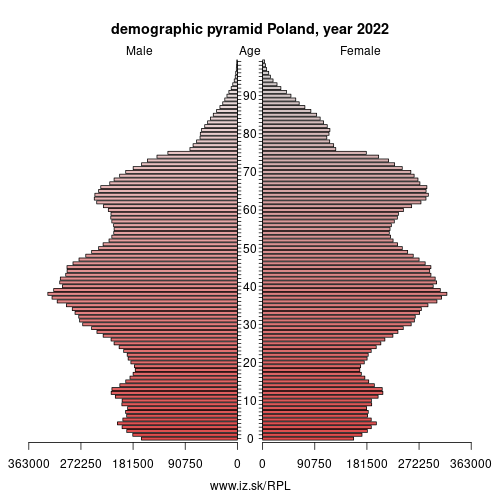
Demographics
| Indicator | Period | Value |
|---|---|---|
| Demographics | ||
| number of inhabitants | 2023 | 3.6753736e+07 |
| population density | 2022 | 121.1 |
| old-age dependency ratio | 2023 | 30.8 |
| Population ageing | ||
| unemployment rate – over 55 years | 2023q4 | 1.8 |
| aggregate replacement ratio | 2022 | 0.61 |
| aggregate replacement ratio – females | 2022 | 0.57 |
| life expectancy of a 50 year old | 2021 | 28 |
| healty life expectancy at 50 years | 2021 | 17.6 |
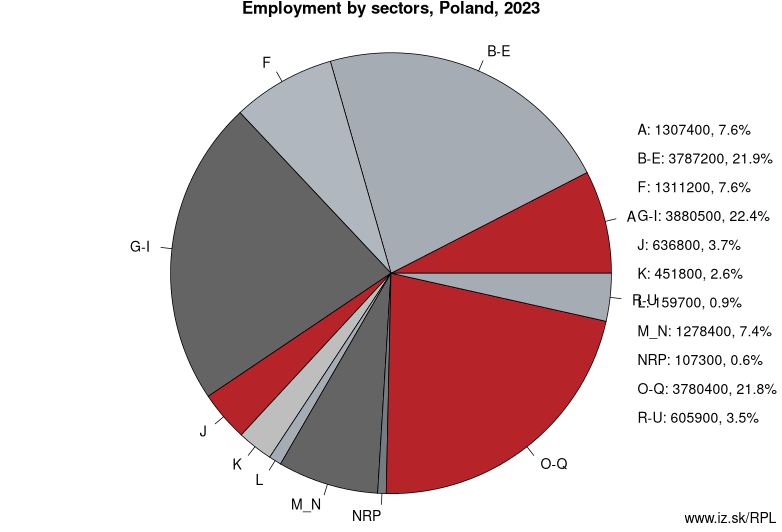
Employment by sectors, Poland
| NACE r2 | % | NACE r2 | % | ||
|---|---|---|---|---|---|
| A | 1375.3 | 8 % | B-E | 3822.4 | 23 % |
| F | 1315.4 | 8 % | G-I | 3772.5 | 23 % |
| J | 490.1 | 3 % | K | 392.6 | 2 % |
| L | 161.6 | 1 % | M_N | 1173.2 | 7 % |
| NRP | 79.1 | 0 % | O-Q | 3557.9 | 21 % |
| R-U | 602.2 | 4 % | TOTAL | 16 742 | 100 % |
Data for the period year 2022. Source of the data is Eurostat, table [lfst_r_lfe2en2].
Poland (Polish: Polska [ˈpɔlska] (listen)), officially the Republic of Poland (Polish: Rzeczpospolita Polska [ʐɛt͡ʂpɔˈspɔlita ˈpɔlska] (listen)), is a country located in Central Europe. It is divided into 16 administrative subdivisions, covering an area of 312,696 square kilometres (120,733 sq mi), and has a largely temperate seasonal climate. With a population of approximately 38.5 million people, Poland is the sixth most populous member state of the European Union. Poland's capital and largest metropolis is Warsaw. Other major cities include Kraków, Łódź, Wrocław, Poznań, Gdańsk, and Szczecin.
Poland is bordered by the Baltic Sea, Lithuania, and Russia's Kaliningrad Oblast to the north, Belarus and Ukraine to the east, Slovakia and the Czech Republic to the south, and Germany to the west.
The history of human activity on Polish soil spans almost 500,000 years. Throughout the Iron Age it became extensively diverse, with various cultures and tribes settling in what was then East Germania. However, it was the Western Polans who dominated the region and gave Poland its name. The establishment of the first Polish state can be traced to AD 966, when Mieszko I, ruler of the realm coextensive with the territory of present-day Poland, converted to Christianity.
Neighbours: Lithuania, Czech Republic, Slovakia, Germany
Subregions: MAKROREGION POŁUDNIOWY, MAKROREGION PÓŁNOCNO-ZACHODNI, MAKROREGION POŁUDNIOWO-ZACHODNI, Makroregion północny, MAKROREGION CENTRALNY, MAKROREGION WSCHODNI, MAKROREGION WOJEWÓDZTWO MAZOWIECKIE
Suggested citation: Michal Páleník: Europe and its regions in numbers - Poland – PL, IZ Bratislava, retrieved from: https://www.iz.sk/PPL, ISBN: 978-80-970204-9-1, DOI:10.5281/zenodo.10200164
Local Administrative Units data of Visegrad countries
Statistical data on LAU1 regions of Slovakia, Czechia, Poland, Hungary. This LAU1 dataset on 733 regions contains data on population, age structure of inhabitants, on number and structure of unemployed and is regularly updated.. . .
 Share
Share Facebook
 Twitter
 News
News