Sud-Est – RO22
EU regions: Romania > Macroregiunea Doi > Sud-Est
| Indicator | Period | Value |
|---|---|---|
| Life long learning | ||
| life long learning participation | 2022 | 6.9 |
| Part time jobs and flexible employment | ||
| percentage of part time workers | 2022 | 5.62 |
| percentage of part time workers, men | 2022 | 5.66 |
| percentage of part time workers, women | 2022 | 5.55 |
| Gender differences | ||
| gender gap in employment rate | 2022 | 66.86 |
| gender gap in unemployment rate | 2022 | 67.47 |
| Graduates and young people | ||
| unemployment rate of youth with elementary education | 2015 | 31 |
| NEET | 2022 | 22.3 |
| Gross domestic product | ||
| GDP per capita in PPS of EU average | 2022 | 60 |
| Employment | ||
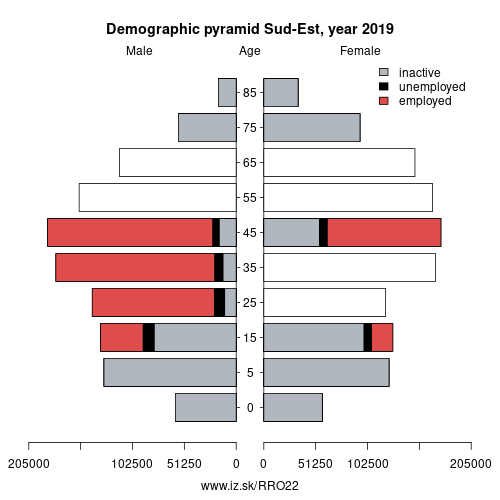
| employment rate | 2022 | 58.2 |
| Social exclusion | ||
| people at risk of poverty or social exclusion | 2020 | 43.2 |
More on wikipedia wikidata Q649864 on OpenStreetMap Sud-Est slovensky: RO22
Subregions: Brăila, Buzău, Constanţa, Galaţi, Tulcea, Vrancea
Unemployment
| Indicator | Period | Value |
|---|---|---|
| Unemployment | ||
| unemployment rate | 2022 | 7.3 |
| youth unemployment rate | 2022 | 20 |
| Long term unemployment | ||
| long term unemployment | 2022 | 1.9 |
| share of long term unemployed | 2022 | 26.8 |
Demographics
| Indicator | Period | Value |
|---|---|---|
| Demographics | ||
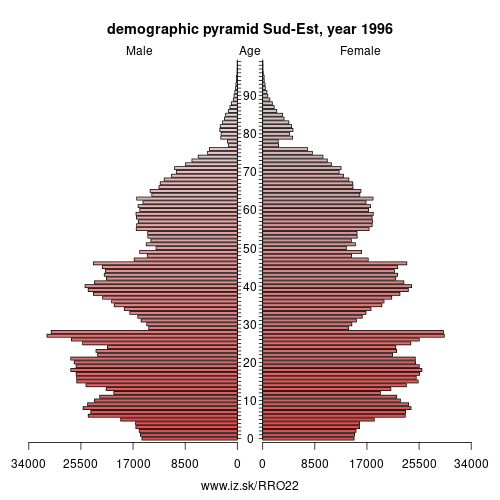
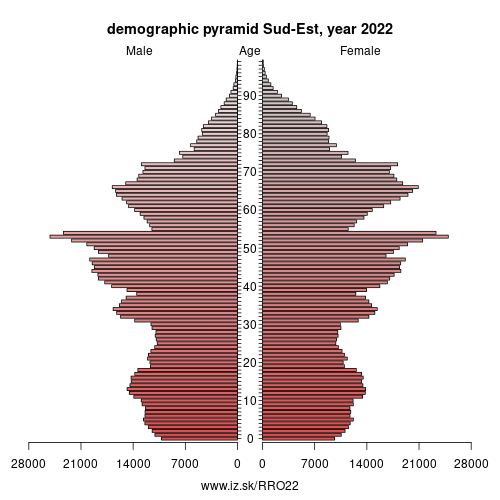
| number of inhabitants | 2023 | 2.353162e+06 |
| population density | 2022 | 70 |
| old-age dependency ratio | 2023 | 33.2 |
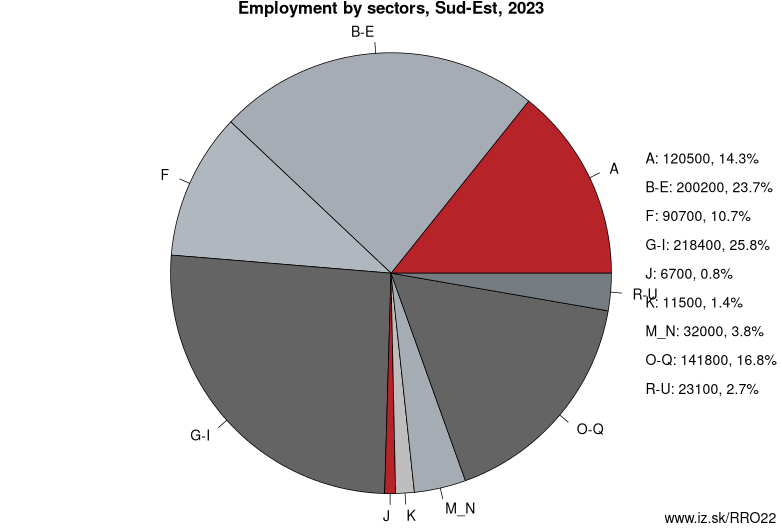
Employment by sectors, Sud-Est
| NACE r2 | % | NACE r2 | % | ||
|---|---|---|---|---|---|
| A | 115.6 | 13 % | B-E | 212 | 25 % |
| F | 93.1 | 11 % | G-I | 225.5 | 26 % |
| K | 11.8 | 1 % | M_N | 33.6 | 4 % |
| O-Q | 146.2 | 17 % | R-U | 18.1 | 2 % |
| TOTAL | 862.3 | 100 % |
Data for the period year 2022. Source of the data is Eurostat, table [lfst_r_lfe2en2].
Other: Macroregiunea Doi, Nord-Est, Sud-Est
Neighbours: Nord-Est, Centru, Severen Tsentralen Planning Region, Severoiztochen Planning Region, Sud-Muntenia
Subregions: Brăila, Buzău, Constanţa, Galaţi, Tulcea, Vrancea
Suggested citation: Michal Páleník: Europe and its regions in numbers - Sud-Est – RO22, IZ Bratislava, retrieved from: https://www.iz.sk/PRO22, ISBN: 978-80-970204-9-1, DOI:10.5281/zenodo.10200164
https://www.iz.sk/en/projects/eu-regions/RO22
 Share
Share Facebook
 Twitter
 News
News