Sweden – SE
More on wikipedia wikidata Q34 on OpenStreetMap Sweden slovensky: SE
Subregions: East Sweden, Southern Sweden, Northern Sweden
Unemployment
| Indicator | Period | Value |
|---|---|---|
| Unemployment | ||
| unemployment rate | 2022 | 7.6 |
| youth unemployment rate | 2023q4 | 20.5 |
| unemployment rate of low educated people | 2023q4 | 23.5 |
| Long term unemployment | ||
| long term unemployment | 2023q4 | 1.7 |
| share of long term unemployed | 2022 | 25.4 |
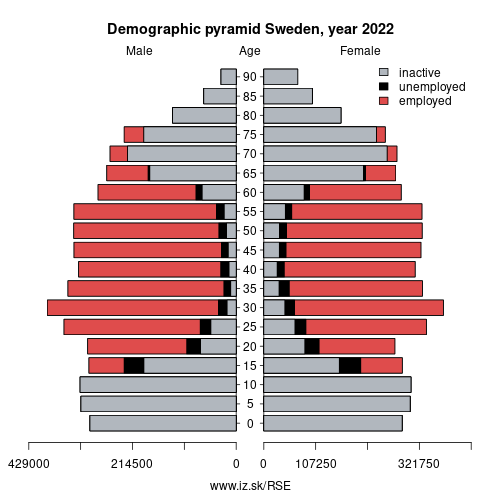
Composition of population according to age group, education and economic activity, Sweden
| Age group | Low education | Middle education | High education |
|---|---|---|---|
| Y20-29 | P: 152.7 E: 80.2; U: 31.2; I: 41.3 | P: 671.9 E: 474.5; U: 50.7; I: 146.7 | P: 396.5 E: 323.6; U: 19.5; I: 53.4 |
| Y30-39 | P: 147.7 E: 93.2; U: 29.7; I: 24.8 | P: 483.7 E: 417.4; U: 20.2; I: 46.1 | P: 810.9 E: 743.4; U: 23.6; I: 43.9 |
| Y40-49 | P: 147.2 E: 93.5; U: 30.0; I: 23.7 | P: 432.5 E: 386.1; U: 14.0; I: 32.4 | P: 709.6 E: 664.5; U: 17.1; I: 28.0 |
| Y50-59 | P: 161.9 E: 103.2; U: 19.4; I: 39.3 | P: 636.1 E: 556.3; U: 25.7; I: 54.1 | P: 524.1 E: 483.5; U: 15.5; I: 25.1 |
| Y60-69 | P: 206.0 E: 81.7; U: 7.6; I: 116.7 | P: 531.7 E: 251.9; U: 13.7; I: 266.1 | P: 367.0 E: 205.2; U: 9.7; I: 152.1 |
Note: in thousands in 2022, according to labour force sample survey. P – total population, E – employed, U – unemployed, I – number of ecnomically inactive
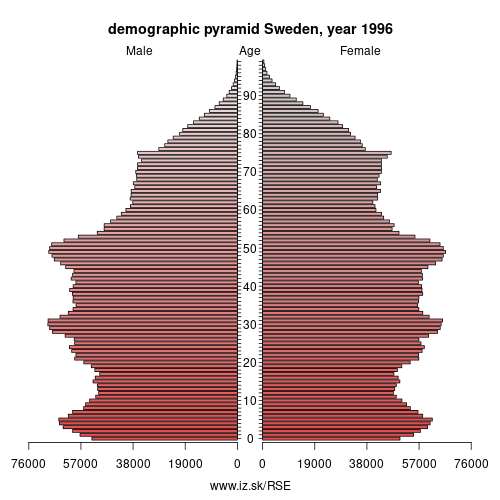
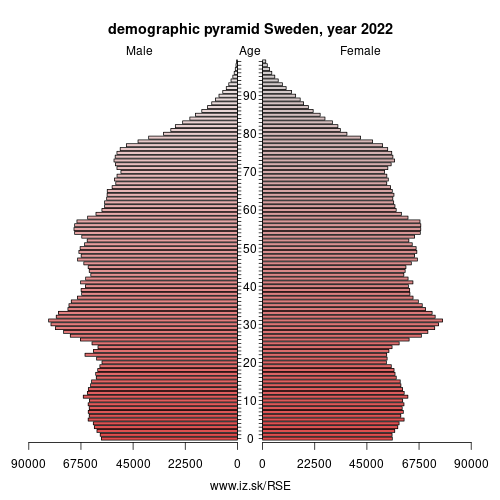
Demographics
| Indicator | Period | Value |
|---|---|---|
| Demographics | ||
| number of inhabitants | 2023 | 1.0521556e+07 |
| population density | 2022 | 25.7 |
| old-age dependency ratio | 2023 | 32.8 |
| Population ageing | ||
| unemployment rate – over 55 years | 2023q4 | 5.7 |
| aggregate replacement ratio | 2023 | 0.59 |
| aggregate replacement ratio – females | 2023 | 0.56 |
| life expectancy of a 50 year old | 2021 | 34.4 |
| healty life expectancy at 50 years | 2021 | 25.1 |
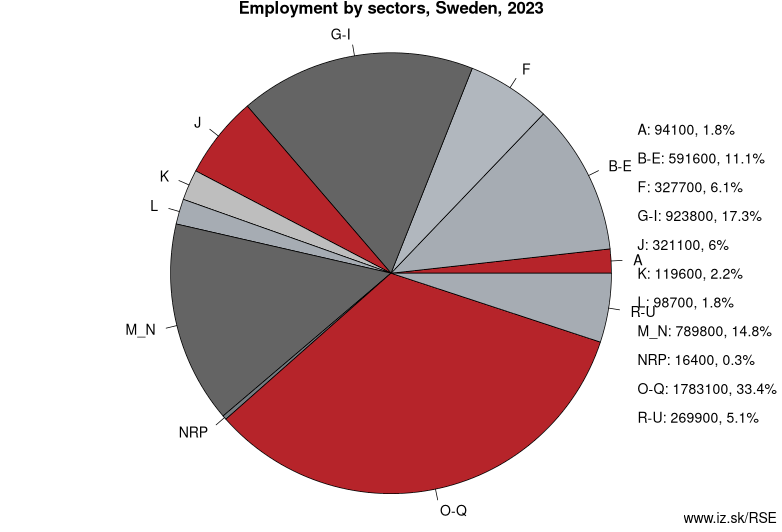
Employment by sectors, Sweden
| NACE r2 | % | NACE r2 | % | ||
|---|---|---|---|---|---|
| A | 97.2 | 2 % | B-E | 564.1 | 11 % |
| F | 336.4 | 6 % | G-I | 900.2 | 17 % |
| J | 314.8 | 6 % | K | 120.7 | 2 % |
| L | 96.6 | 2 % | M_N | 777.9 | 15 % |
| NRP | 32.4 | 1 % | O-Q | 1761.7 | 34 % |
| R-U | 253.9 | 5 % | TOTAL | 5255.8 | 100 % |
Data for the period year 2022. Source of the data is Eurostat, table [lfst_r_lfe2en2].
Sweden (Swedish: Sverige [ˈsværjɛ] (listen)), officially the Kingdom of Sweden (Swedish: Konungariket Sverige ), is a Scandinavian Nordic country in Northern Europe. It borders Norway to the west and north and Finland to the east, and is connected to Denmark in the southwest by a bridge-tunnel across the Öresund Strait. At 450,295 square kilometres (173,860 sq mi), Sweden is the largest country in Northern Europe, the third-largest country in the European Union and the fifth largest country in Europe by area. The capital city is Stockholm. Sweden has a total population of 10.3 million of which 2.5 million have a foreign background. It has a low population density of 22 inhabitants per square kilometre (57/sq mi) and the highest urban concentration is in the central and southern half of the country.
Sweden is part of the geographical area of Fennoscandia. The climate is in general very mild for its northerly latitude due to significant maritime influence. In spite of the high latitude, Sweden often has warm continental summers, being located in between the North Atlantic, the Baltic Sea and the vast Eurasian Russian landmass. The general climate and environment varies significantly from the south and north due to the vast latitudal difference and much of Sweden has reliably cold and snowy winters.
Other: Sweden, Slovakia, Slovenia
Subregions: East Sweden, Southern Sweden, Northern Sweden
Suggested citation: Michal Páleník: Europe and its regions in numbers - Sweden – SE, IZ Bratislava, retrieved from: https://www.iz.sk/PSE, ISBN: 978-80-970204-9-1, DOI:10.5281/zenodo.10200164
 Share
Share Facebook
 Twitter
 News
News