Southern Sweden – SE2
EU regions: Sweden > Southern Sweden
| Indicator | Period | Value |
|---|---|---|
| Life long learning | ||
| life long learning participation | 2022 | 36.3 |
| Part time jobs and flexible employment | ||
| percentage of part time workers | 2022 | 21.29 |
| percentage of part time workers, men | 2022 | 14.15 |
| percentage of part time workers, women | 2022 | 29.61 |
| Gender differences | ||
| gender gap in employment rate | 2022 | 92.38 |
| gender gap in unemployment rate | 2022 | 123.08 |
| Graduates and young people | ||
| unemployment rate of youth with elementary education | 2022 | 34.5 |
| NEET | 2022 | 4.6 |
| Gross domestic product | ||
| GDP per capita in PPS of EU average | 2022 | 108 |
| Employment | ||
| employment rate | 2022 | 77.1 |
| Social exclusion | ||
| people at risk of poverty or social exclusion | 2020 | 18.7 |
wikidata Q1426049 Southern Sweden slovensky: SE2
Subregions: Småland and the islands, South Sweden, West Sweden
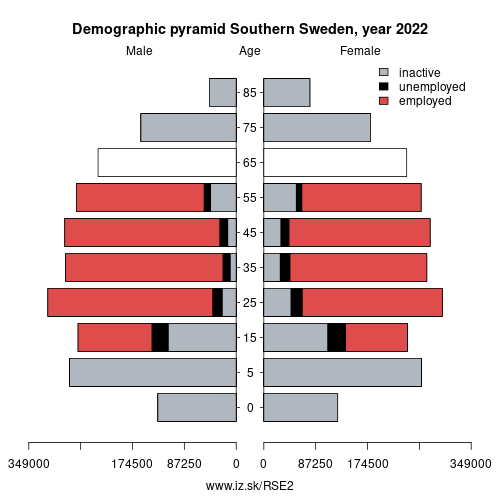
Unemployment
| Indicator | Period | Value |
|---|---|---|
| Unemployment | ||
| unemployment rate | 2022 | 7.4 |
| youth unemployment rate | 2022 | 20.4 |
| Long term unemployment | ||
| long term unemployment | 2022 | 1.7 |
| share of long term unemployed | 2022 | 23.9 |
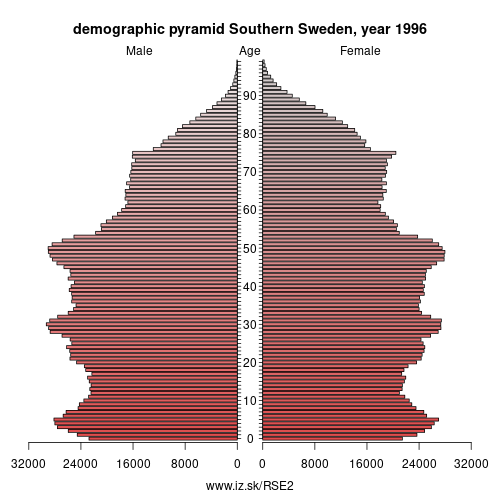
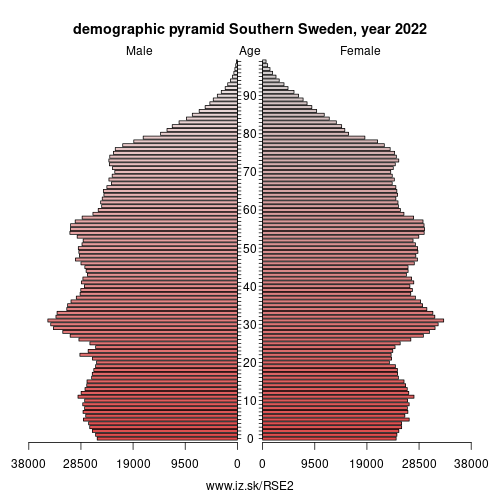
Demographics
| Indicator | Period | Value |
|---|---|---|
| Demographics | ||
| number of inhabitants | 2023 | 4.556857e+06 |
| population density | 2022 | 59.5 |
| old-age dependency ratio | 2023 | 33.7 |
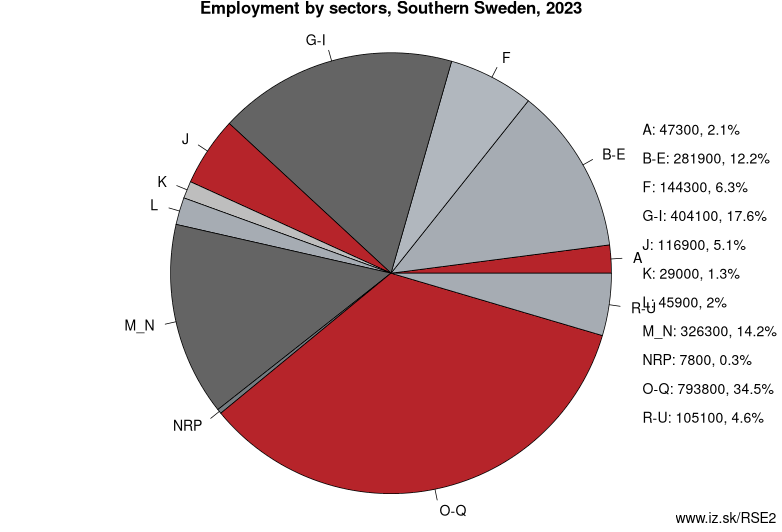
Employment by sectors, Southern Sweden
| NACE r2 | % | NACE r2 | % | ||
|---|---|---|---|---|---|
| A | 50.7 | 2 % | B-E | 275.2 | 12 % |
| F | 152.1 | 7 % | G-I | 396.4 | 17 % |
| J | 107.6 | 5 % | K | 32.2 | 1 % |
| L | 41.6 | 2 % | M_N | 315.9 | 14 % |
| NRP | 15.7 | 1 % | O-Q | 779.5 | 34 % |
| R-U | 98.8 | 4 % | TOTAL | 2265.7 | 100 % |
Data for the period year 2022. Source of the data is Eurostat, table [lfst_r_lfe2en2].
Other: Sweden, East Sweden, Southern Sweden, Northern Sweden
Neighbours: East Sweden, Norway, Northern Sweden
Subregions: Småland and the islands, South Sweden, West Sweden
Suggested citation: Michal Páleník: Europe and its regions in numbers - Southern Sweden – SE2, IZ Bratislava, retrieved from: https://www.iz.sk/PSE2, ISBN: 978-80-970204-9-1, DOI:10.5281/zenodo.10200164
https://www.iz.sk/en/projects/eu-regions/SE2
 Share
Share Facebook
 Twitter
 News
News