Slovenia – SI
More on wikipedia wikidata Q215 on OpenStreetMap Slovenia slovensky: SI
Subregions: Slovenia, Eastern Slovenia, Western Slovenia
Unemployment
| Indicator | Period | Value |
|---|---|---|
| Unemployment | ||
| unemployment rate | 2023q4 | 3.4 |
| youth unemployment rate | 2022 | 10.1 |
| unemployment rate of low educated people | 2023q4 | 7.9 |
| Long term unemployment | ||
| long term unemployment | 2023q4 | 1.1 |
| share of long term unemployed | 2023q4 | 28 |
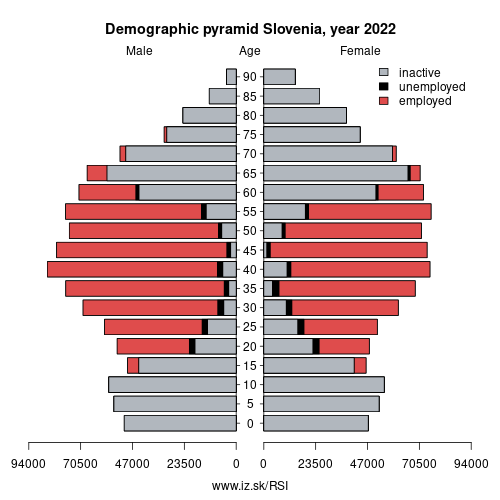
Composition of population according to age group, education and economic activity, Slovenia
| Age group | Low education | Middle education | High education |
|---|---|---|---|
| Y20-29 | P: 10.1 E: 5.0; U: 1.2; I: 3.9 | P: 134.2 E: 83.6; U: 6.8; I: 43.8 | P: 58.4 E: 44.1; U: 2.9; I: 11.4 |
| Y30-39 | P: 13.8 E: 8.8; U: 1.2; I: 3.8 | P: 121.7 E: 106.9; U: 5.5; I: 9.3 | P: 136.4 E: 127.0; U: 3.7; I: 5.7 |
| Y40-49 | P: 20.7 E: 13.6; U: 1.4; I: 5.7 | P: 155.8 E: 141.2; U: 4.3; I: 10.3 | P: 137.9 E: 133.3; U: 2.2; I: 2.4 |
| Y50-59 | P: 36.8 E: 21.3; U: 1.2; I: 14.3 | P: 163.5 E: 133.8; U: 3.9; I: 25.8 | P: 97.2 E: 91.3; U: 1.6; I: 4.3 |
| Y60-69 | P: 53.0 E: 6.2; U: 0.4; I: 46.4 | P: 161.8 E: 27.9; U: 1.8; I: 132.1 | P: 64.6 E: 25.5; U: 1.0; I: 38.1 |
Note: in thousands in 2022, according to labour force sample survey. P – total population, E – employed, U – unemployed, I – number of ecnomically inactive
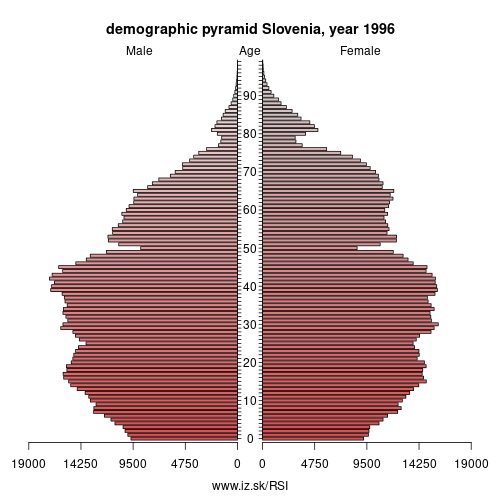
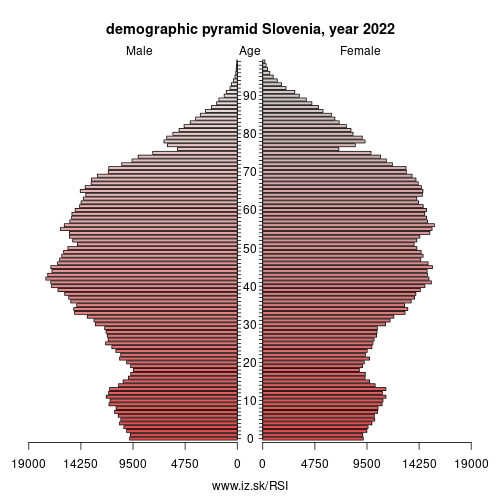
Demographics
| Indicator | Period | Value |
|---|---|---|
| Demographics | ||
| number of inhabitants | 2023 | 2.116972e+06 |
| population density | 2022 | 104.8 |
| old-age dependency ratio | 2023 | 33.7 |
| Population ageing | ||
| unemployment rate – over 55 years | 2023q4 | 3.8 |
| aggregate replacement ratio | 2023 | 0.44 |
| aggregate replacement ratio – females | 2023 | 0.45 |
| life expectancy of a 50 year old | 2021 | 32.1 |
| healty life expectancy at 50 years | 2021 | 20.4 |
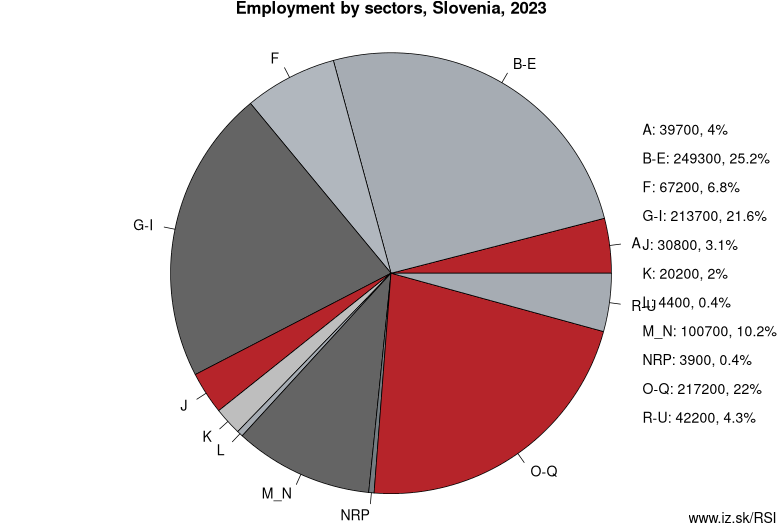
Employment by sectors, Slovenia
| NACE r2 | % | NACE r2 | % | ||
|---|---|---|---|---|---|
| A | 42.3 | 4 % | B-E | 240.7 | 24 % |
| F | 55.7 | 6 % | G-I | 198.7 | 20 % |
| J | 36.3 | 4 % | K | 22.9 | 2 % |
| L | 5.2 | 1 % | M_N | 99.6 | 10 % |
| NRP | 3.7 | 0 % | O-Q | 237.7 | 24 % |
| R-U | 43.3 | 4 % | TOTAL | 986.1 | 100 % |
Data for the period year 2022. Source of the data is Eurostat, table [lfst_r_lfe2en2].
From Wikipedia: Slovenia ( (listen) sloh-VEE-nee-ə; Slovene: Slovenija [slɔˈʋèːnija]), officially the Republic of Slovenia (Slovene: Republika Slovenija , abbr.: RS), is a country located in southern Central Europe at a crossroads of important European cultural and trade routes. It is bordered by Italy to the west, Austria to the north, Hungary to the northeast, Croatia to the southeast, and the Adriatic Sea to the southwest. It covers 20,273 square kilometers (7,827 sq mi) and has a population of 2.07 million. One of the successor states of the former Yugoslavia, Slovenia is a parliamentary republic and a member of the United Nations, of the European Union, and of NATO. The capital and largest city is Ljubljana.
Slovenia has a mostly mountainous terrain with a mainly continental climate, with the exception of the Slovene Littoral, which has a sub-Mediterranean climate, and of the northwest, which has an Alpine climate. Additionally, the Dinaric Alps and the Pannonian Plain meet on the territory of Slovenia. The country, marked by a significant biological diversity, is one of the most water-rich in Europe, with a dense river network, a rich aquifer system, and significant karst underground watercourses. Over half of the territory is covered by forest. The human settlement of Slovenia is dispersed and uneven.
Slovenia has historically been the crossroads of Slavic, Germanic, and Romance languages and cultures. Although the population is not homogeneous, Slovenes comprise the majority. The South Slavic language Slovene is the official language throughout the country.
Other: Sweden, Slovakia, Slovenia
Neighbours: Croatia, Italy, Hungary, Austria
Subregions: Slovenia, Eastern Slovenia, Western Slovenia
Suggested citation: Michal Páleník: Europe and its regions in numbers - Slovenia – SI, IZ Bratislava, retrieved from: https://www.iz.sk/PSI, ISBN: 978-80-970204-9-1, DOI:10.5281/zenodo.10200164
 Share
Share Facebook
 Twitter
 News
News