Slovakia – SK
More on wikipedia wikidata Q214 on OpenStreetMap Slovakia slovensky: SK
Subregions: Slovakia, Bratislava Region, Western Slovakia, Central Slovakia, Eastern Slovakia
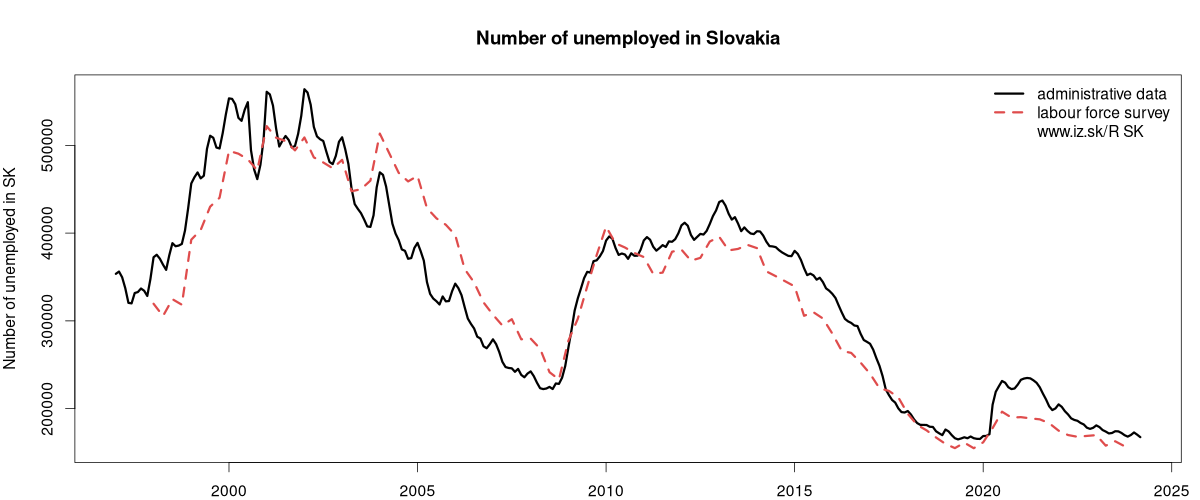
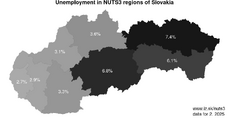
Unemployment
| Indicator | Period | Value |
|---|---|---|
| Unemployment | ||
| unemployment rate | 2023q4 | 5.7 |
| youth unemployment rate | 2022 | 19.9 |
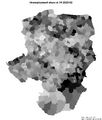
| unemployment rate of low educated people | 2023q4 | 38.3 |
| Long term unemployment | ||
| long term unemployment | 2023q4 | 3.7 |
| share of long term unemployed | 2023q4 | 65.6 |
| Unemployment according to labour offices | ||
| number of registered unemployed | February 2024 | 170 325 |
| number of unemployed women | February 2024 | 90 917 |
| number of long-term unemployed | February 2024 | 69 671 |
Comparisson of unemployment according to ILO methodology and registered unemployment yeilds some differences.
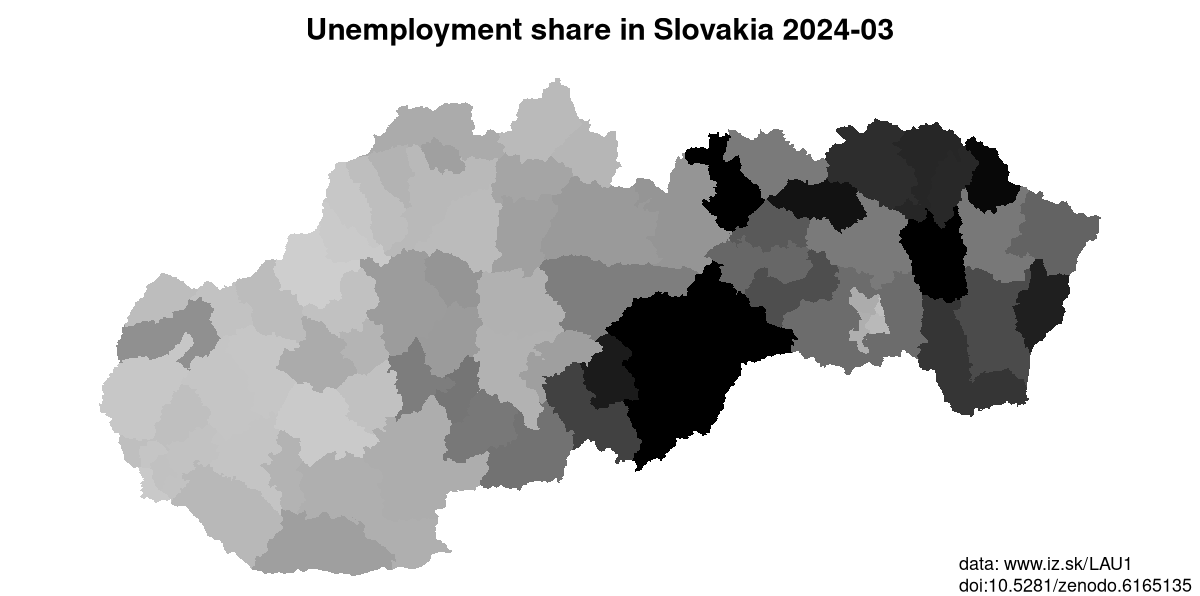
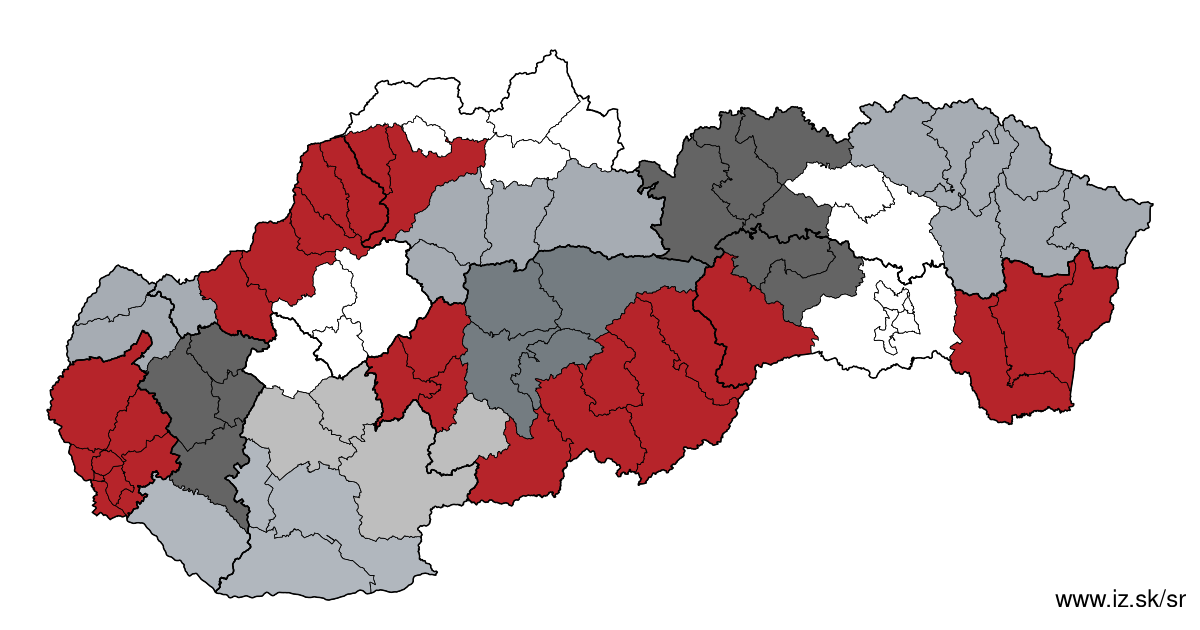
Data on unemployment in counties of Slovakia are available at Local Administrative Units data of Visegrad countries.
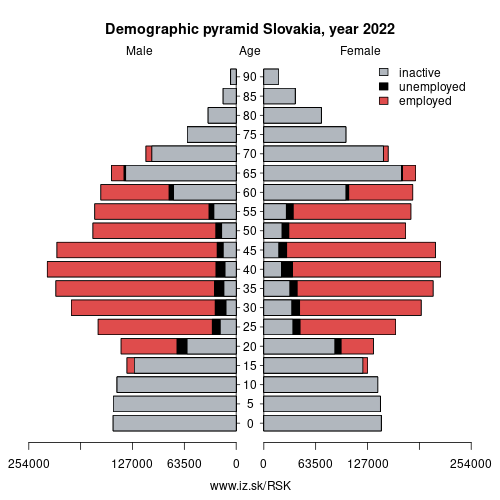
Composition of population according to age group, education and economic activity, Slovakia
| Age group | Low education | Middle education | High education |
|---|---|---|---|
| Y20-29 | P: 47.2 E: ; U: ; I: 28.2 | P: 385.9 E: 239.3; U: 24.1; I: 122.5 | P: 168.0 E: 115.6; U: 6.4; I: 46.0 |
| Y30-39 | P: 51.3 E: 21.1; U: 10.2; I: 20.0 | P: 447.2 E: 374.4; U: 26.9; I: 45.9 | P: 317.4 E: 289.7; U: 7.3; I: 20.4 |
| Y40-49 | P: 45.6 E: 10.8; U: 19.4; I: 15.4 | P: 579.9 E: 516.5; U: 23.9; I: 39.5 | P: 245.6 E: 233.2; U: 4.8; I: 7.6 |
| Y50-59 | P: 42.4 E: 11.2; U: 14.4; I: 16.8 | P: 515.8 E: 431.1; U: 17.3; I: 67.4 | P: 138.4 E: 130.2; U: 1.5; I: 6.7 |
| Y60-69 | P: 80.7 E: 6.1; U: 1.5; I: 73.1 | P: 478.0 E: 128.1; U: 4.9; I: 345.0 | P: 121.9 E: 56.2; U: 0.5; I: 65.2 |
Note: in thousands in 2022, according to labour force sample survey. P – total population, E – employed, U – unemployed, I – number of ecnomically inactive
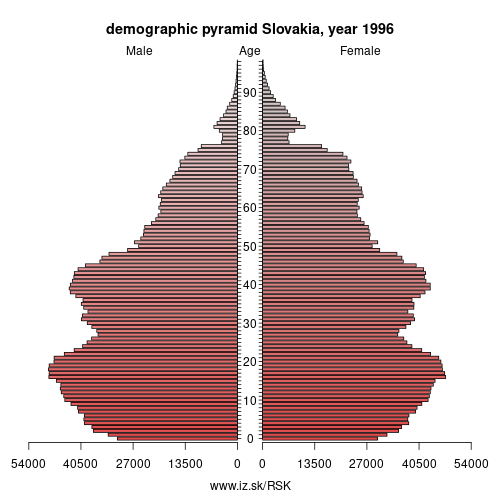
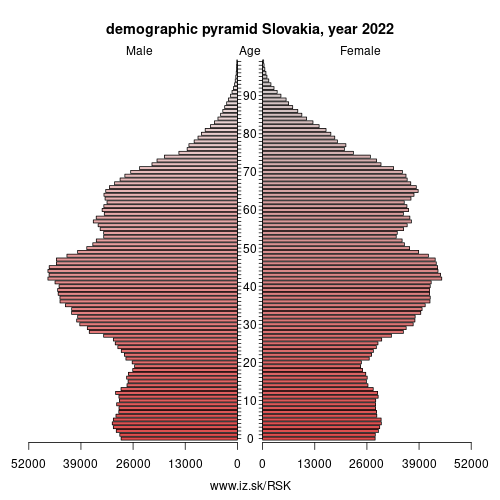
Demographics
| Indicator | Period | Value |
|---|---|---|
| Demographics | ||
| number of inhabitants | 2023 | 5.428792e+06 |
| population density | 2022 | 111.5 |
| old-age dependency ratio | 2023 | 27 |
| Population ageing | ||
| unemployment rate – over 55 years | 2023q4 | 3.5 |
| aggregate replacement ratio | 2023 | 0.62 |
| aggregate replacement ratio – females | 2023 | 0.6 |
| life expectancy of a 50 year old | 2021 | 26.9 |
| healty life expectancy at 50 years | 2021 | 12.8 |
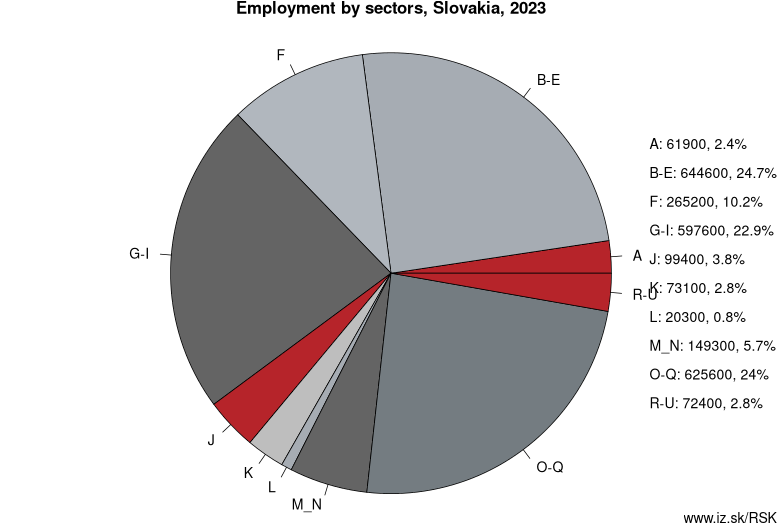
Employment by sectors, Slovakia
| NACE r2 | % | NACE r2 | % | ||
|---|---|---|---|---|---|
| A | 66.1 | 3 % | B-E | 678.1 | 26 % |
| F | 254.9 | 10 % | G-I | 565.2 | 22 % |
| J | 107.9 | 4 % | K | 62.9 | 2 % |
| L | 19 | 1 % | M_N | 147.8 | 6 % |
| O-Q | 628.6 | 24 % | R-U | 72.7 | 3 % |
| TOTAL | 2603.9 | 100 % |
Data for the period year 2022. Source of the data is Eurostat, table [lfst_r_lfe2en2].
From Wikipedia: Slovakia ( (listen); Slovak: Slovensko [ˈslɔʋɛnskɔ] (listen)), officially the Slovak Republic (Slovak: Slovenská republika, listen ), is a landlocked country in Central Europe. It is bordered by Poland to the north, Ukraine to the east, Hungary to the south, Austria to the west, and the Czech Republic to the northwest. Slovakia's mostly mountainous territory spans about 49,000 square kilometres (19,000 sq mi), with a population of over 5.4 million. The capital and largest city is Bratislava, and the second-largest city is Košice.
The Slavs arrived in the territory of present-day Slovakia in the 5th and 6th centuries. In the 7th century, they played a significant role in the creation of Samo's Empire. In the 9th century, they established the Principality of Nitra, which was later conquered by the Principality of Moravia to establish Great Moravia. In the 10th century, after the dissolution of Great Moravia, the territory was integrated into the Principality of Hungary, which would then become the Kingdom of Hungary in 1000. In 1241 and 1242, after the Mongol invasion of Europe, much of the territory was destroyed. The area was recovered largely thanks to Béla IV of Hungary, who also settled Germans; leading them to become an important ethnic group in the area, especially in what are today parts of central and eastern Slovakia.
After World War I, and the dissolution of Austria-Hungary, the state of Czechoslovakia was established.
Other: Sweden, Slovakia, Slovenia
Neighbours: Czech Republic, Poland, Hungary, Austria
Subregions: Slovakia, Bratislava Region, Western Slovakia, Central Slovakia, Eastern Slovakia
Suggested citation: Michal Páleník: Regions of Slovakia - Slovakia – SK, IZ Bratislava, retrieved from: https://www.iz.sk/en/projects/eu-regions/SK
Local Administrative Units data of Visegrad countries
Statistical data on LAU1 regions of Slovakia, Czechia, Poland, Hungary. This LAU1 dataset on 733 regions contains data on population, age structure of inhabitants, on number and structure of unemployed and is regularly updated.. . .
Regions of the Slovak Republic
Due to the need of analysis we have created regions of Slovakia. We will bring more information about these regions from the macroeconomic point of view as well as from the point of view of the labour market.. . .
Similar articles
Unemployment of Czechia and Slovakia, Regions of the Slovak Republic, Unemployment structure in the Visegrad region, Regions of the European Union, Labour market indicators of slovak regions., Local Administrative Units data of Visegrad countries, NUTS3 regions of Slovakia, Counties of Slovakia
 Share
Share Facebook
 Twitter
 News
News