Essex – UKH3
EU regions: United Kingdom > East of England > Essex
| Indicator | Period | Value |
|---|---|---|
| Life long learning | ||
| life long learning participation | 2019 | 12.1 |
| Part time jobs and flexible employment | ||
| percentage of part time workers | 2019 | 24.26 |
| percentage of part time workers, men | 2019 | 8.97 |
| percentage of part time workers, women | 2019 | 41.64 |
| Gender differences | ||
| gender gap in employment rate | 2019 | 91.36 |
| gender gap in unemployment rate | 2019 | 113.33 |
| Graduates and young people | ||
| unemployment rate of youth with elementary education | 2017 | 24.6 |
| NEET | 2019 | 8.6 |
| Employment | ||
| employment rate | 2019 | 77.5 |
More on wikipedia wikidata Q23240 on OpenStreetMap Essex slovensky: UKH3
Subregions: Southend-on-Sea, Thurrock, Essex Haven Gateway, West Essex, Heart of Essex, Essex Thames Gateway
Unemployment
| Indicator | Period | Value |
|---|---|---|
| Unemployment | ||
| unemployment rate | 2019 | 3.2 |
| youth unemployment rate | 2019 | 6.5 |
| Long term unemployment | ||
| long term unemployment | 2019 | 0.7 |
| share of long term unemployed | 2019 | 23.2 |
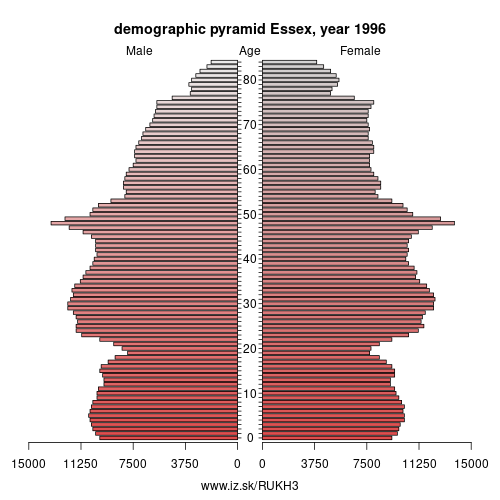
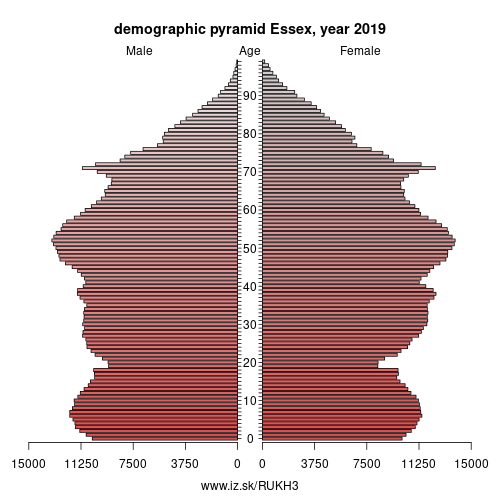
Demographics
| Indicator | Period | Value |
|---|---|---|
| Demographics | ||
| number of inhabitants | 2019 | 1.841887e+06 |
| population density | 2018 | 500 |
| old-age dependency ratio | 2019 | 32.1 |
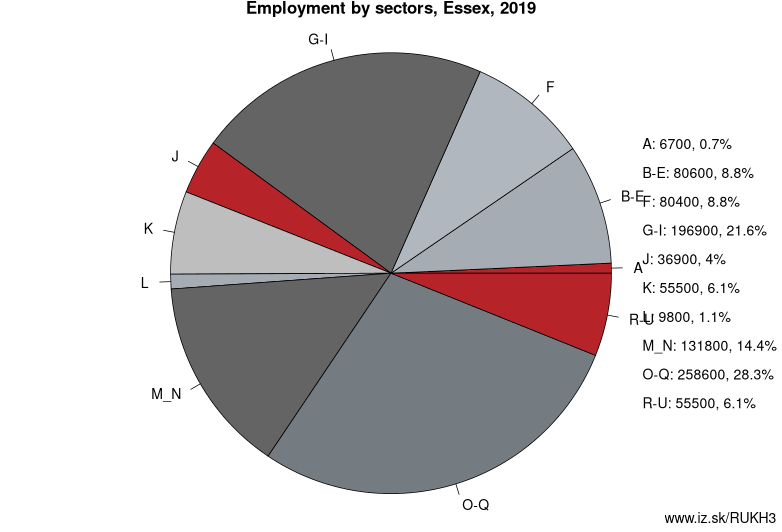
Employment by sectors, Essex
| NACE r2 | % | NACE r2 | % | ||
|---|---|---|---|---|---|
| A | 6.7 | 1 % | B-E | 80.6 | 9 % |
| F | 80.4 | 9 % | G-I | 196.9 | 22 % |
| J | 36.9 | 4 % | K | 55.5 | 6 % |
| L | 9.8 | 1 % | M_N | 131.8 | 14 % |
| O-Q | 258.6 | 28 % | R-U | 55.5 | 6 % |
| TOTAL | 914.9 | 100 % |
Data for the period year 2019. Source of the data is Eurostat, table [lfst_r_lfe2en2].
Essex () is a county in the south-east of England, north-east of London. One of the home counties, it borders Suffolk and Cambridgeshire to the north, Hertfordshire to the west, Kent across the estuary of the River Thames to the south, and London to the south-west. The county town is Chelmsford, the only city in the county. For government statistical purposes Essex is placed in the East of England region.
There are three definitions of the extent of Essex, the widest being the Ancient County, the more usual being the smaller Ceremonial County and smallest being the administrative county – the area administered by the County Council and which excludes the two unitary authorities of Thurrock and Southend-on-Sea.
The Ceremonial County occupies the eastern part of what was, during the Early Middle Ages, the Kingdom of Essex. As well as rural areas, the county also includes London Stansted Airport, the new towns of Basildon and Harlow, Lakeside Shopping Centre, the port of Tilbury and the borough of Southend-on-Sea.
History
Essex had its roots in the Kingdom of the East Saxons, a polity which is likely to have had its roots in the territory of the Iron Age Trinovantes tribe.
Iron Age
Colchester in the north-east of the county is Britain's oldest recorded town, dating from before the Roman conquest, when it was known as Camulodunum and was sufficiently well-developed to have its own mint. The area was part of the territory of the Trinovantes tribe, who were subsumed into the conquering Catuvellauni in the decades prior to the Roman invasion in 43 AD.
Anglo-Saxon Period
The name Essex originates in the Anglo-Saxon period of the Early Middle Ages and has its root in the Anglo-Saxon (Old English) name Ēastseaxe ("East Saxons"), the eastern kingdom of the Saxons who had come from the continent and settled in Britain (cf. Middlesex, Sussex and Wessex) during the Heptarchy.
Other: East of England, Essex, East Anglia, Bedfordshire and Hertfordshire
Neighbours: Bedfordshire and Hertfordshire, East Anglia, Outer London – East and North East
Subregions: Southend-on-Sea, Thurrock, Essex Haven Gateway, West Essex, Heart of Essex, Essex Thames Gateway
Suggested citation: Michal Páleník: Europe and its regions in numbers - Essex – UKH3, IZ Bratislava, retrieved from: https://www.iz.sk/PUKH3, ISBN: 978-80-970204-9-1, DOI:10.5281/zenodo.10200164
 Share
Share Facebook
 Twitter
 News
News