East of England – UKH
EU regions: United Kingdom > East of England
| Indicator | Period | Value |
|---|---|---|
| Life long learning | ||
| life long learning participation | 2019 | 13.5 |
| Part time jobs and flexible employment | ||
| percentage of part time workers | 2019 | 25.43 |
| percentage of part time workers, men | 2019 | 10.4 |
| percentage of part time workers, women | 2019 | 42.56 |
| Gender differences | ||
| gender gap in employment rate | 2019 | 89.2 |
| gender gap in unemployment rate | 2019 | 100 |
| Graduates and young people | ||
| unemployment rate of youth with elementary education | 2019 | 18.1 |
| NEET | 2019 | 10 |
| Employment | ||
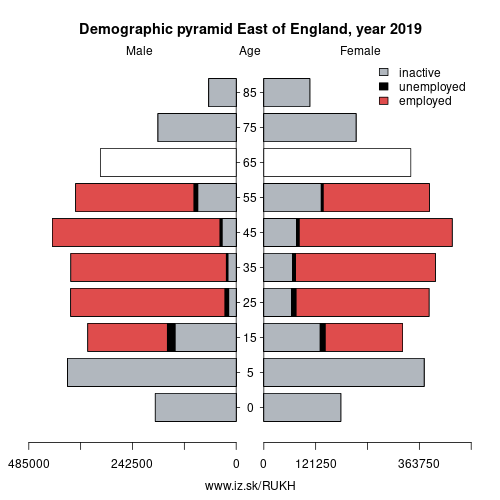
| employment rate | 2019 | 77.9 |
More on wikipedia wikidata Q48006 on OpenStreetMap East of England slovensky: UKH
Subregions: East Anglia, Bedfordshire and Hertfordshire, Essex
Unemployment
| Indicator | Period | Value |
|---|---|---|
| Unemployment | ||
| unemployment rate | 2019 | 3 |
| youth unemployment rate | 2019 | 8.5 |
| Long term unemployment | ||
| long term unemployment | 2019 | 0.7 |
| share of long term unemployed | 2019 | 24.7 |
Demographics
| Indicator | Period | Value |
|---|---|---|
| Demographics | ||
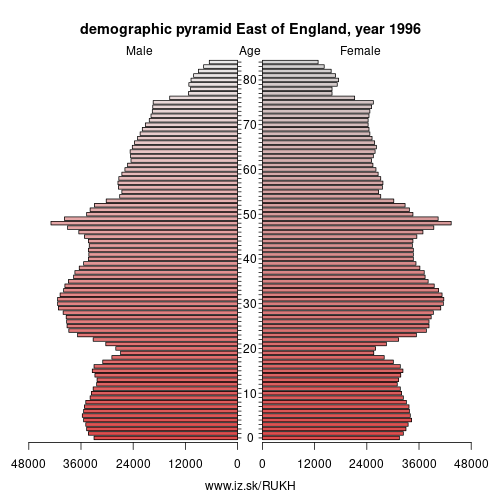
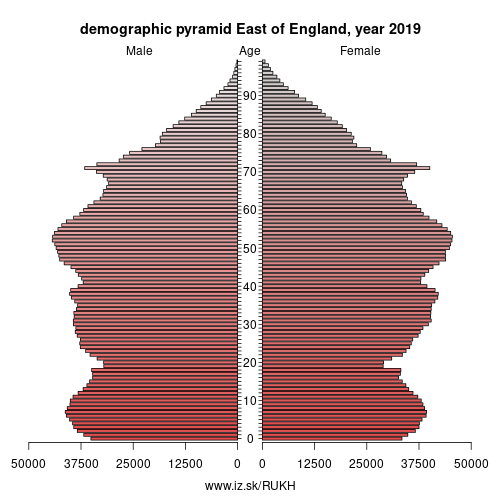
| number of inhabitants | 2019 | 6.23541e+06 |
| population density | 2018 | 325.2 |
| old-age dependency ratio | 2019 | 31.8 |
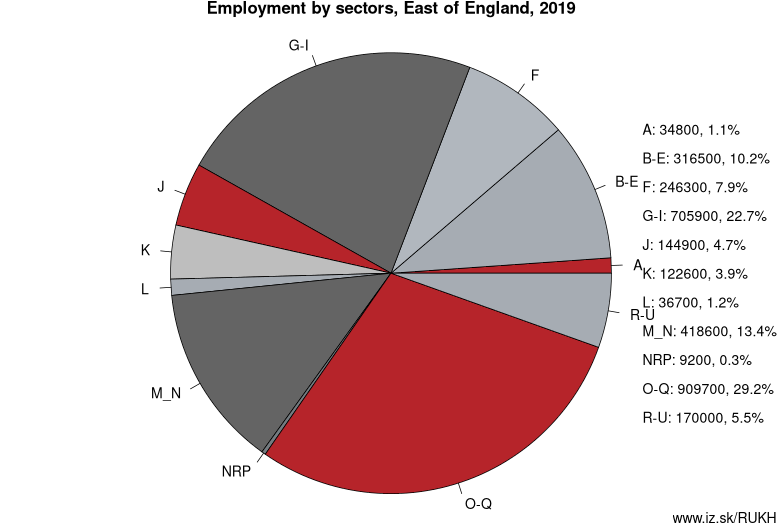
Employment by sectors, East of England
| NACE r2 | % | NACE r2 | % | ||
|---|---|---|---|---|---|
| A | 34.8 | 1 % | B-E | 316.5 | 10 % |
| F | 246.3 | 8 % | G-I | 705.9 | 23 % |
| J | 144.9 | 5 % | K | 122.6 | 4 % |
| L | 36.7 | 1 % | M_N | 418.6 | 13 % |
| NRP | 9.2 | 0 % | O-Q | 909.7 | 29 % |
| R-U | 170 | 5 % | TOTAL | 3115.2 | 100 % |
Data for the period year 2019. Source of the data is Eurostat, table [lfst_r_lfe2en2].
Other: United Kingdom, North West England, Northern Ireland, Scotland, West Midlands, Wales, East of England, Greater London, South East England, South West England, East Midlands, North East England, Yorkshire and the Humber
Neighbours: Greater London, East Midlands, South East England
Subregions: East Anglia, Bedfordshire and Hertfordshire, Essex
Suggested citation: Michal Páleník: Europe and its regions in numbers - East of England – UKH, IZ Bratislava, retrieved from: https://www.iz.sk/PUKH, ISBN: 978-80-970204-9-1, DOI:10.5281/zenodo.10200164
 Share
Share Facebook
 Twitter
 News
News