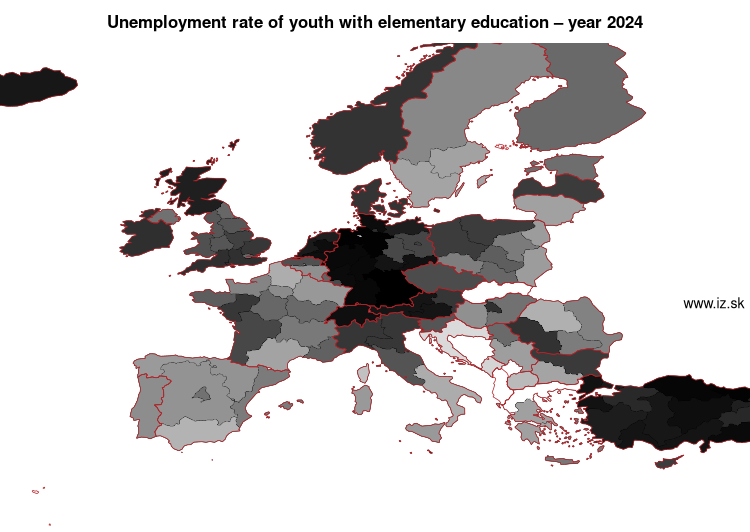
Unemployment rate of youth with elementary education NUTS 1 – year 2024
| Order | Code | Region | Value | Note |
|---|
| 1. | Bavaria | DE2 | 7,3 |
| 2. | East Black Sea Region (statistical) | TR9 | 7,5 |
| 3. | West Black Sea Region (statistical) | TR8 | 8 |
| 4. | Lower Saxony | DE9 | 8,3 |
| 5. | Southeast Anatolia Region (statistical) | TRC | 8,9 |
| 6. | Rhineland-Palatinate | DEB | 9,1 | period 2019 |
| 7. | Schleswig-Holstein | DEF | 9,3 | period 2019 |
| 8. | Eastern Netherlands | NL2 | 9,5 |
| 9. | Baden-Württemberg | DE1 | 9,6 |
| 10. | Southern Netherlands | NL4 | 9,7 |
| 11. | Central Anatolia Region (statistical) | TR7 | 9,8 |
| 12. | Hesse | DE7 | 9,8 |
| 13. | SCHWEIZ/SUISSE/SVIZZERA | CH0 | 10 |
| 14. | North Rhine-Westphalia | DEA | 10,3 |
| 15. | Saxony | DED | 10,4 | period 2019 |
| 16. | West Marmara Region | TR2 | 10,5 |
| 17. | Mediterranean Region (statistical) | TR6 | 11 |
| 18. | Thuringia | DEG | 11 | period 2008 |
| 19. | Western Austria | AT3 | 11,1 |
| 20. | Southern Austria | AT2 | 11,2 |
| 21. | West Anatolia Region (statistical) | TR5 | 11,6 |
| 22. | Iceland | IS0 | 11,6 |
| 23. | Western Netherlands | NL3 | 12,2 |
| 24. | Istanbul Province | TR1 | 12,4 |
| 25. | Mecklenburg-Vorpommern | DE8 | 12,8 | period 2009 |
| 26. | Aegean Region (statistical) | TR3 | 12,9 |
| 27. | Malta | MT0 | 13 |
| 28. | Northern Netherlands | NL1 | 13,1 |
| 29. | Northeast Anatolia Region (statistical) | TRA | 13,2 |
| 30. | Scotland | UKM | 13,2 | period 2019 |
| 31. | Central East Anatolia Region (statistical) | TRB | 15 |
| 32. | East Marmara Region (statistical) | TR4 | 15,2 |
| 33. | Hamburg | DE6 | 16,2 | period 2009 |
| 34. | Ireland | IE0 | 16,6 |
| 35. | South West England | UKK | 16,6 | period 2019 |
| 36. | South East England | UKJ | 16,7 | period 2019 |
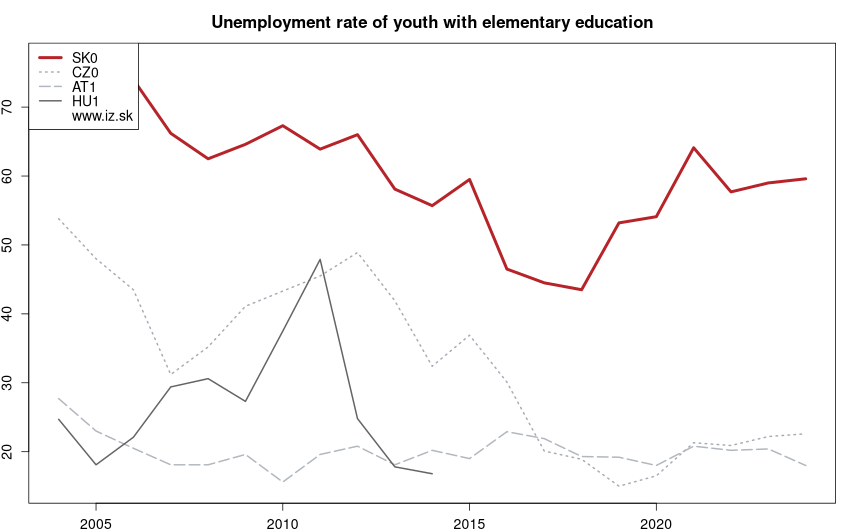
| 37. | Central Hungary | HU1 | 16,8 | period 2016 |
| 38. | Macroregiunea Patru | RO4 | 17,2 | period 2013 |
| 39. | Norway | NO0 | 17,3 |
| 40. | Denmark | DK0 | 17,5 |
| 41. | East Austria | AT1 | 18 |
| 42. | Northwest Italy | ITC | 18 |
| 43. | East of England | UKH | 18,1 | period 2019 |
| 44. | Northeast Italy | ITH | 18,2 |
| 45. | Pays de la Loire | FRG | 18,2 |
| 46. | Northern and Eastern Bulgaria | BG3 | 18,9 | period 2019 |
| 47. | Latvia | LV0 | 19 |
| 48. | Cyprus | CY0 | 19,2 |
| 49. | MAKROREGION PÓŁNOCNO-ZACHODNI | PL4 | 19,3 | period 2016 |
| 50. | Makroregion północny | PL6 | 19,3 | period 2018 |
| 51. | Berlin | DE3 | 19,9 | period 2019 |
| 52. | East Midlands | UKF | 20,2 | period 2019 |
| 53. | Brandenburg | DE4 | 21,3 | period 2012 |
| 54. | Nouvelle-Aquitaine | FRI | 21,5 |
| 55. | Saxony-Anhalt | DEE | 21,7 | period 2015 |
| 56. | Saarland | DEC | 22,2 | period 2009 |
| 57. | Czech Republic | CZ0 | 22,6 |
| 58. | Flemish Region | BE2 | 23,3 |
| 59. | Wales | UKL | 23,4 | period 2019 |
| 60. | Central Italy | ITI | 24,2 |
| 61. | Slovenia | SI0 | 24,5 |
| 62. | West Midlands | UKG | 24,7 | period 2019 |
| 63. | North West England | UKD | 24,8 | period 2019 |
| 64. | Yorkshire and the Humber | UKE | 24,8 | period 2019 |
| 65. | Brittany | FRH | 26 |
| 66. | MAKROREGION CENTRALNY | PL7 | 26,2 | period 2014 |
| 67. | Provence-Alpes-Côte d'Azur | FRL | 26,8 |
| 68. | Luxembourg | LU0 | 27,6 |
| 69. | Centre-Val de Loire | FRB | 28,1 |
| 70. | MAKROREGION POŁUDNIOWY | PL2 | 28,1 | period 2017 |
| 71. | North East England | UKC | 28,2 | period 2019 |
| 72. | Mainland Finland | FI1 | 28,5 |
| 73. | Bourgogne-Franche-Comté | FRC | 28,6 | period 2023 |
| 74. | Greater London | UKI | 28,7 | period 2019 |
| 75. | Serbia-North | RS1 | 28,7 |
| 76. | Estonia | EE0 | 29,5 |
| 77. | Community of Madrid | ES3 | 30,1 |
| 78. | Great Plain and North | HU3 | 30,2 |
| 79. | Northern Ireland | UKN | 30,3 | period 2016 |
| 80. | Aegean Islands and Crete | EL4 | 31,5 | period 2017 |
| 81. | Auvergne-Rhône-Alpes | FRK | 31,9 |
| 82. | Este | ES5 | 32,3 |
| 83. | MAKROREGION WOJEWÓDZTWO MAZOWIECKIE | PL9 | 32,3 | period 2017 |
| 84. | Macroregiunea Trei | RO3 | 32,5 |
| 85. | MAKROREGION POŁUDNIOWO-ZACHODNI | PL5 | 32,8 | period 2015 |
| 86. | Macroregiunea Doi | RO2 | 33,7 |
| 87. | Normandy | FRD | 34,1 |
| 88. | Brussels-Capital Region | BE1 | 34,4 |
| 89. | Canary Islands | ES7 | 34,7 |
| 90. | Northern Sweden | SE3 | 35 |
| 91. | Île-de-France | FR1 | 35,6 |
| 92. | Continental Portugal | PT1 | 36 |
| 93. | Wallonia | BE3 | 36,4 |
| 94. | Transdanubia | HU2 | 36,6 |
| 95. | Noreste | ES2 | 37,2 |
| 96. | Centro | ES4 | 37,3 |
| 97. | Grand Est | FRF | 38,3 |
| 98. | Insular Italy | ITG | 38,5 |
| 99. | Noroeste | ES1 | 38,7 |
| 100. | East Macroregion | PL8 | 39 | period 2016 |
| 101. | Serbia-South | RS2 | 39,6 |
| 102. | Central Greece | EL6 | 40 | period 2023 |
| 103. | Lithuania | LT0 | 40,2 |
| 104. | East Sweden | SE1 | 40,4 |
| 105. | Occitania | FRJ | 40,5 |
| 106. | Southern Sweden | SE2 | 40,7 |
| 107. | South-Western and South-Central Bulgaria | BG4 | 40,8 | period 2014 |
| 108. | Attica Region | EL3 | 41,2 |
| 109. | South Italy | ITF | 42,4 |
| 110. | Hauts-de-France | FRE | 42,6 |
| 111. | North Macedonia | MK0 | 42,7 |
| 112. | Macroregiunea Unu | RO1 | 43,2 |
| 113. | Sur | ES6 | 43,8 |
| 114. | Corsica | FRM | 46,8 | period 2016 |
| 115. | Montenegro | ME0 | 50,7 | period 2016 |
| 116. | HRVATSKA | HR0 | 51,9 |
| 117. | overseas department and region of France | FRY | 56,9 |
| 118. | Slovakia | SK0 | 59,6 |
|---|
| 119. | Northern Greece | EL5 | 72,9 | period 2021 |
Data for the period year 2024. Source of the data is Eurostat, table [lfst_r_lfu3rt].
See also:
Suggested citation: Michal Páleník: Europe and its regions in numbers - Unemployment rate of youth with elementary education NUTS 1 – year 2024, IZ Bratislava, retrieved from: https://www.iz.sk/en/projects/EU-indicators/youth-rate-of-unemployment-primary-education-nuts-1, ISBN: 978-80-970204-9-1, DOI:10.5281/zenodo.10200164
https://www.iz.sk/en/projects/EU-indicators/youth-rate-of-unemployment-primary-education-nuts-1
Slovakia suffers from weak connections between education and labour market, which results in high unemployment of graduates and young people.. . .
 Share
Share Facebook
 Twitter
 News
News