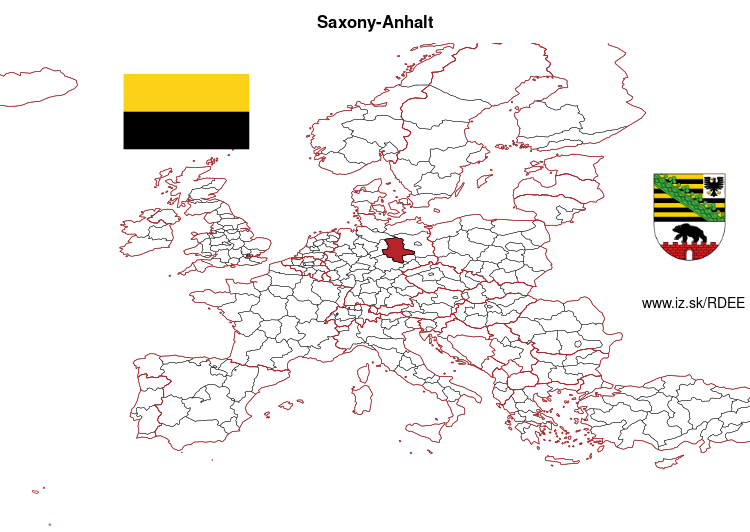
Saxony-Anhalt – DEE
EU regions: Germany > Saxony-Anhalt
| Indicator | Period | Value |
|---|---|---|
| Life long learning | ||
| life long learning participation | 2025 | 7.4 |
| Part time jobs and flexible employment | ||
| percentage of part time workers | 2025 | 24.48 |
| percentage of part time workers, men | 2025 | 11.45 |
| percentage of part time workers, women | 2025 | 38.96 |
| Gender differences | ||
| gender gap in employment rate | 2025 | 96.97 |
| gender gap in unemployment rate | 2025 | 76.36 |
| Graduates and young people | ||
| unemployment rate of youth with elementary education | 2015 | 21.7 |
| NEET | 2025 | 8.8 |
| Gross domestic product | ||
| GDP per capita in PPS of EU average | 2024 | 83 |
| Employment | ||
| employment rate | 2025 | 74.9 |
Saxony-Anhalt slovensky: DEE
Subregions: Saxony-Anhalt, Dessau-Roßlau, Halle (Saale), Magdeburg, Altmarkkreis Salzwedel, Anhalt-Bitterfeld, Jerichower Land, Börde district, Burgenlandkreis, Harz District, Mansfeld-Südharz, Saalekreis, Salzlandkreis, Stendal District, Wittenberg
Unemployment
| Indicator | Period | Value |
|---|---|---|
| Unemployment | ||
| unemployment rate | 2025 | 4.9 |
| youth unemployment rate | 2019 | 6.7 |
| Long term unemployment | ||
| long term unemployment | 2025 | 2 |
| share of long term unemployed | 2025 | 40.2 |
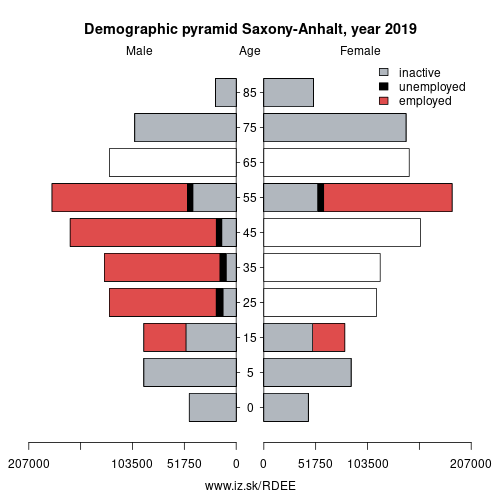
Demographics
| Indicator | Period | Value |
|---|---|---|
| Demographics | ||
| number of inhabitants | 2025 | 2 135 597 |
| population density | 2024 | 105.7 |
| old-age dependency ratio | 2025 | 48 |
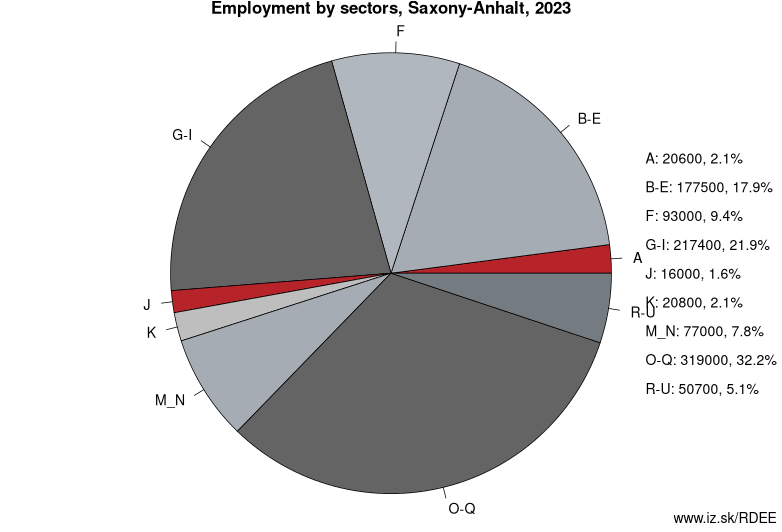
Employment by sectors, Saxony-Anhalt
| NACE r2 | % | NACE r2 | % | ||
|---|---|---|---|---|---|
| A | 17.9 | 2% | B-E | 160.5 | 17% |
| F | 78.8 | 8% | G-I | 226 | 23% |
| J | 19.6 | 2% | K | 17.8 | 2% |
| M_N | 93.1 | 10% | O-Q | 301.5 | 31% |
| R-U | 44.6 | 5% | TOTAL | 967.3 | 100% |
Data for the period year 2025. Source of the data is Eurostat, table [lfst_r_lfe2en2].
Other: Germany, Thuringia, Saarland, Saxony, Saxony-Anhalt, Baden-Württemberg, Hamburg, Berlin, North Rhine-Westphalia, Hesse, Bavaria, Schleswig-Holstein, Mecklenburg-Vorpommern, Brandenburg, Rhineland-Palatinate, Bremen, Lower Saxony
Neighbours: Lower Saxony, Brandenburg, Saxony, Thuringia
Subregions: Saxony-Anhalt, Dessau-Roßlau, Halle (Saale), Magdeburg, Altmarkkreis Salzwedel, Anhalt-Bitterfeld, Jerichower Land, Börde district, Burgenlandkreis, Harz District, Mansfeld-Südharz, Saalekreis, Salzlandkreis, Stendal District, Wittenberg
Suggested citation: Michal Páleník: Europe and its regions in numbers - Saxony-Anhalt – DEE, IZ Bratislava, retrieved from: https://www.iz.sk/PDEE, ISBN: 978-80-970204-9-1, DOI:10.5281/zenodo.10200164
 Share
Share Facebook
 Twitter
 News
News