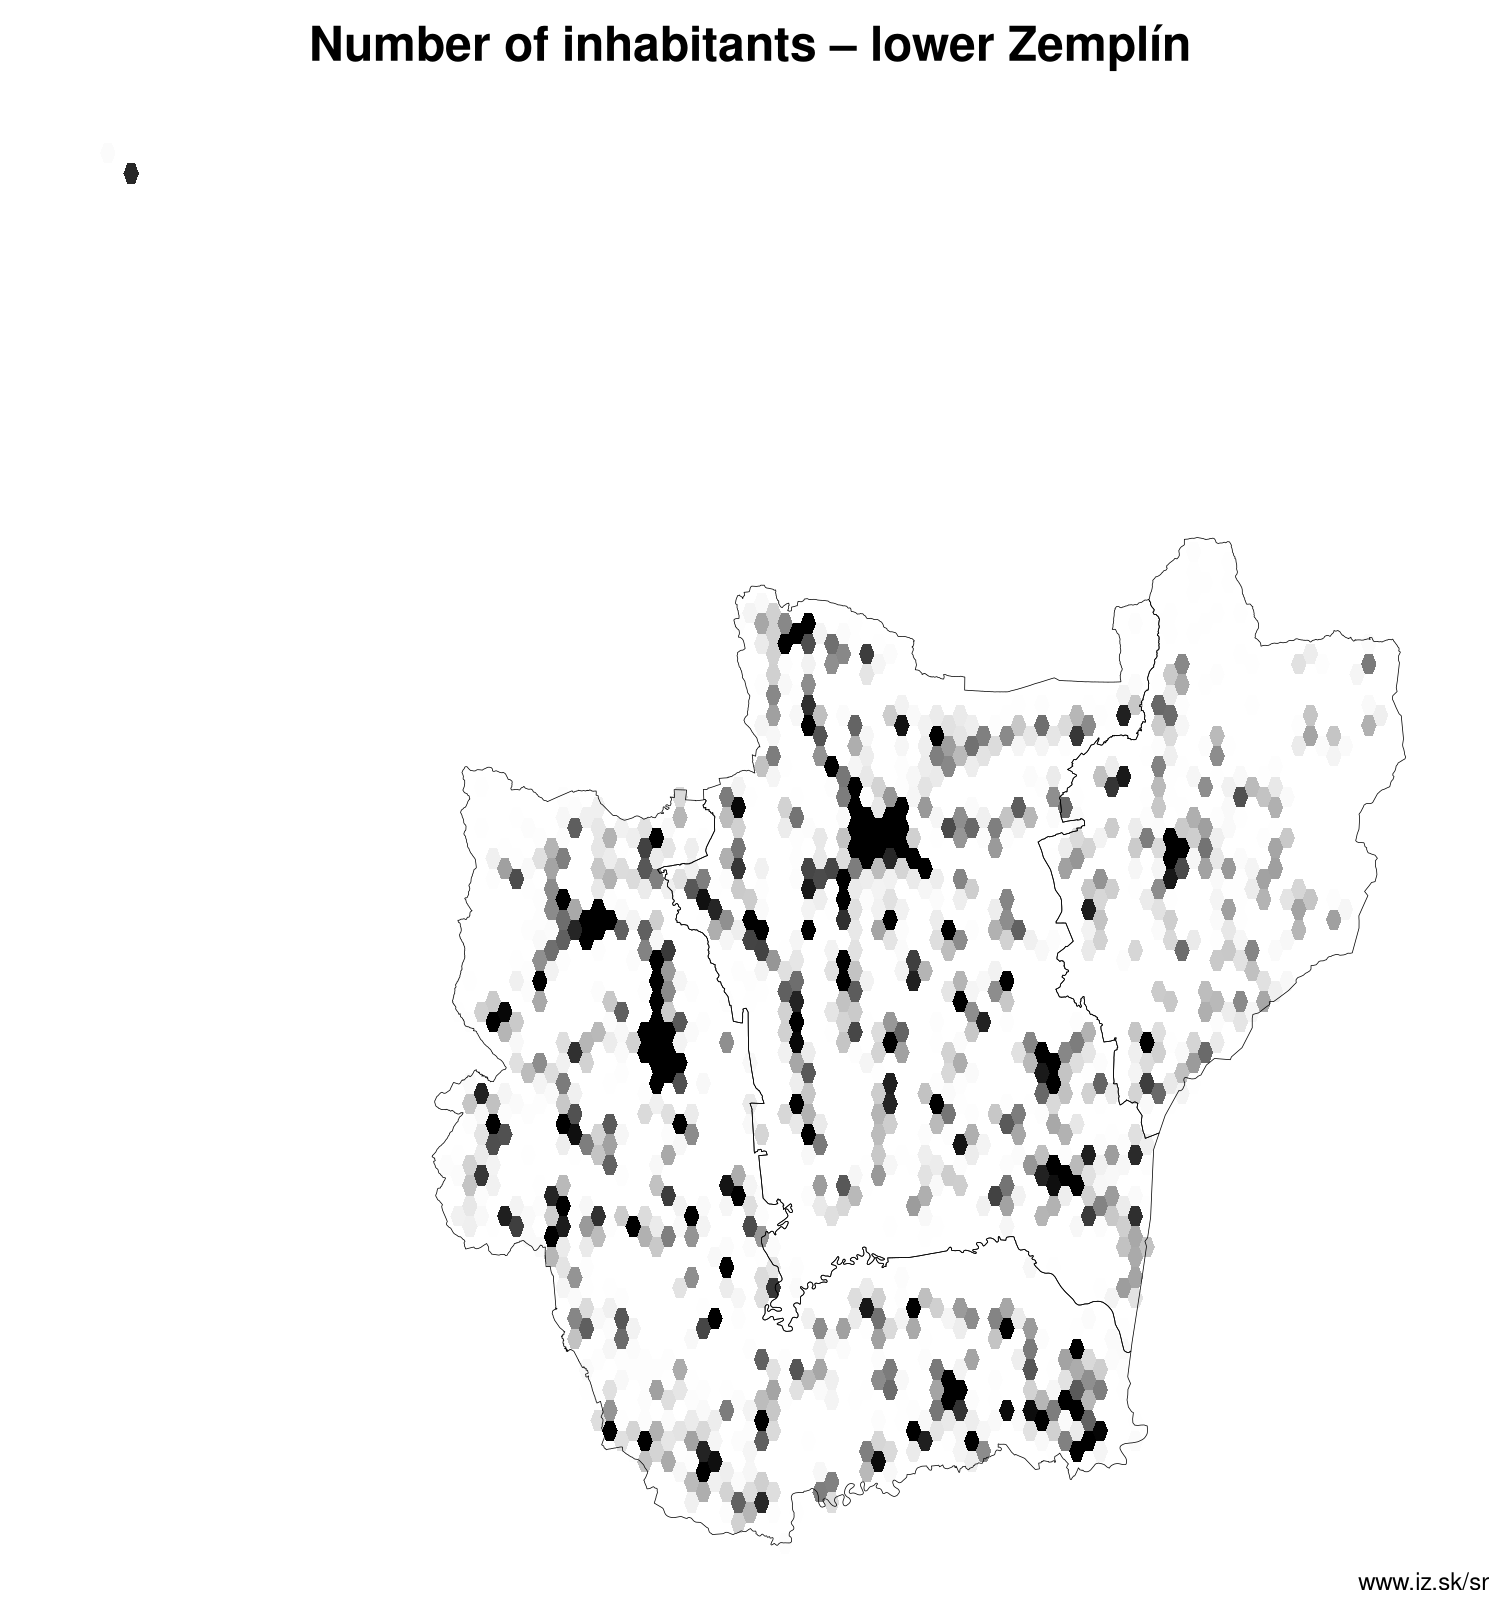
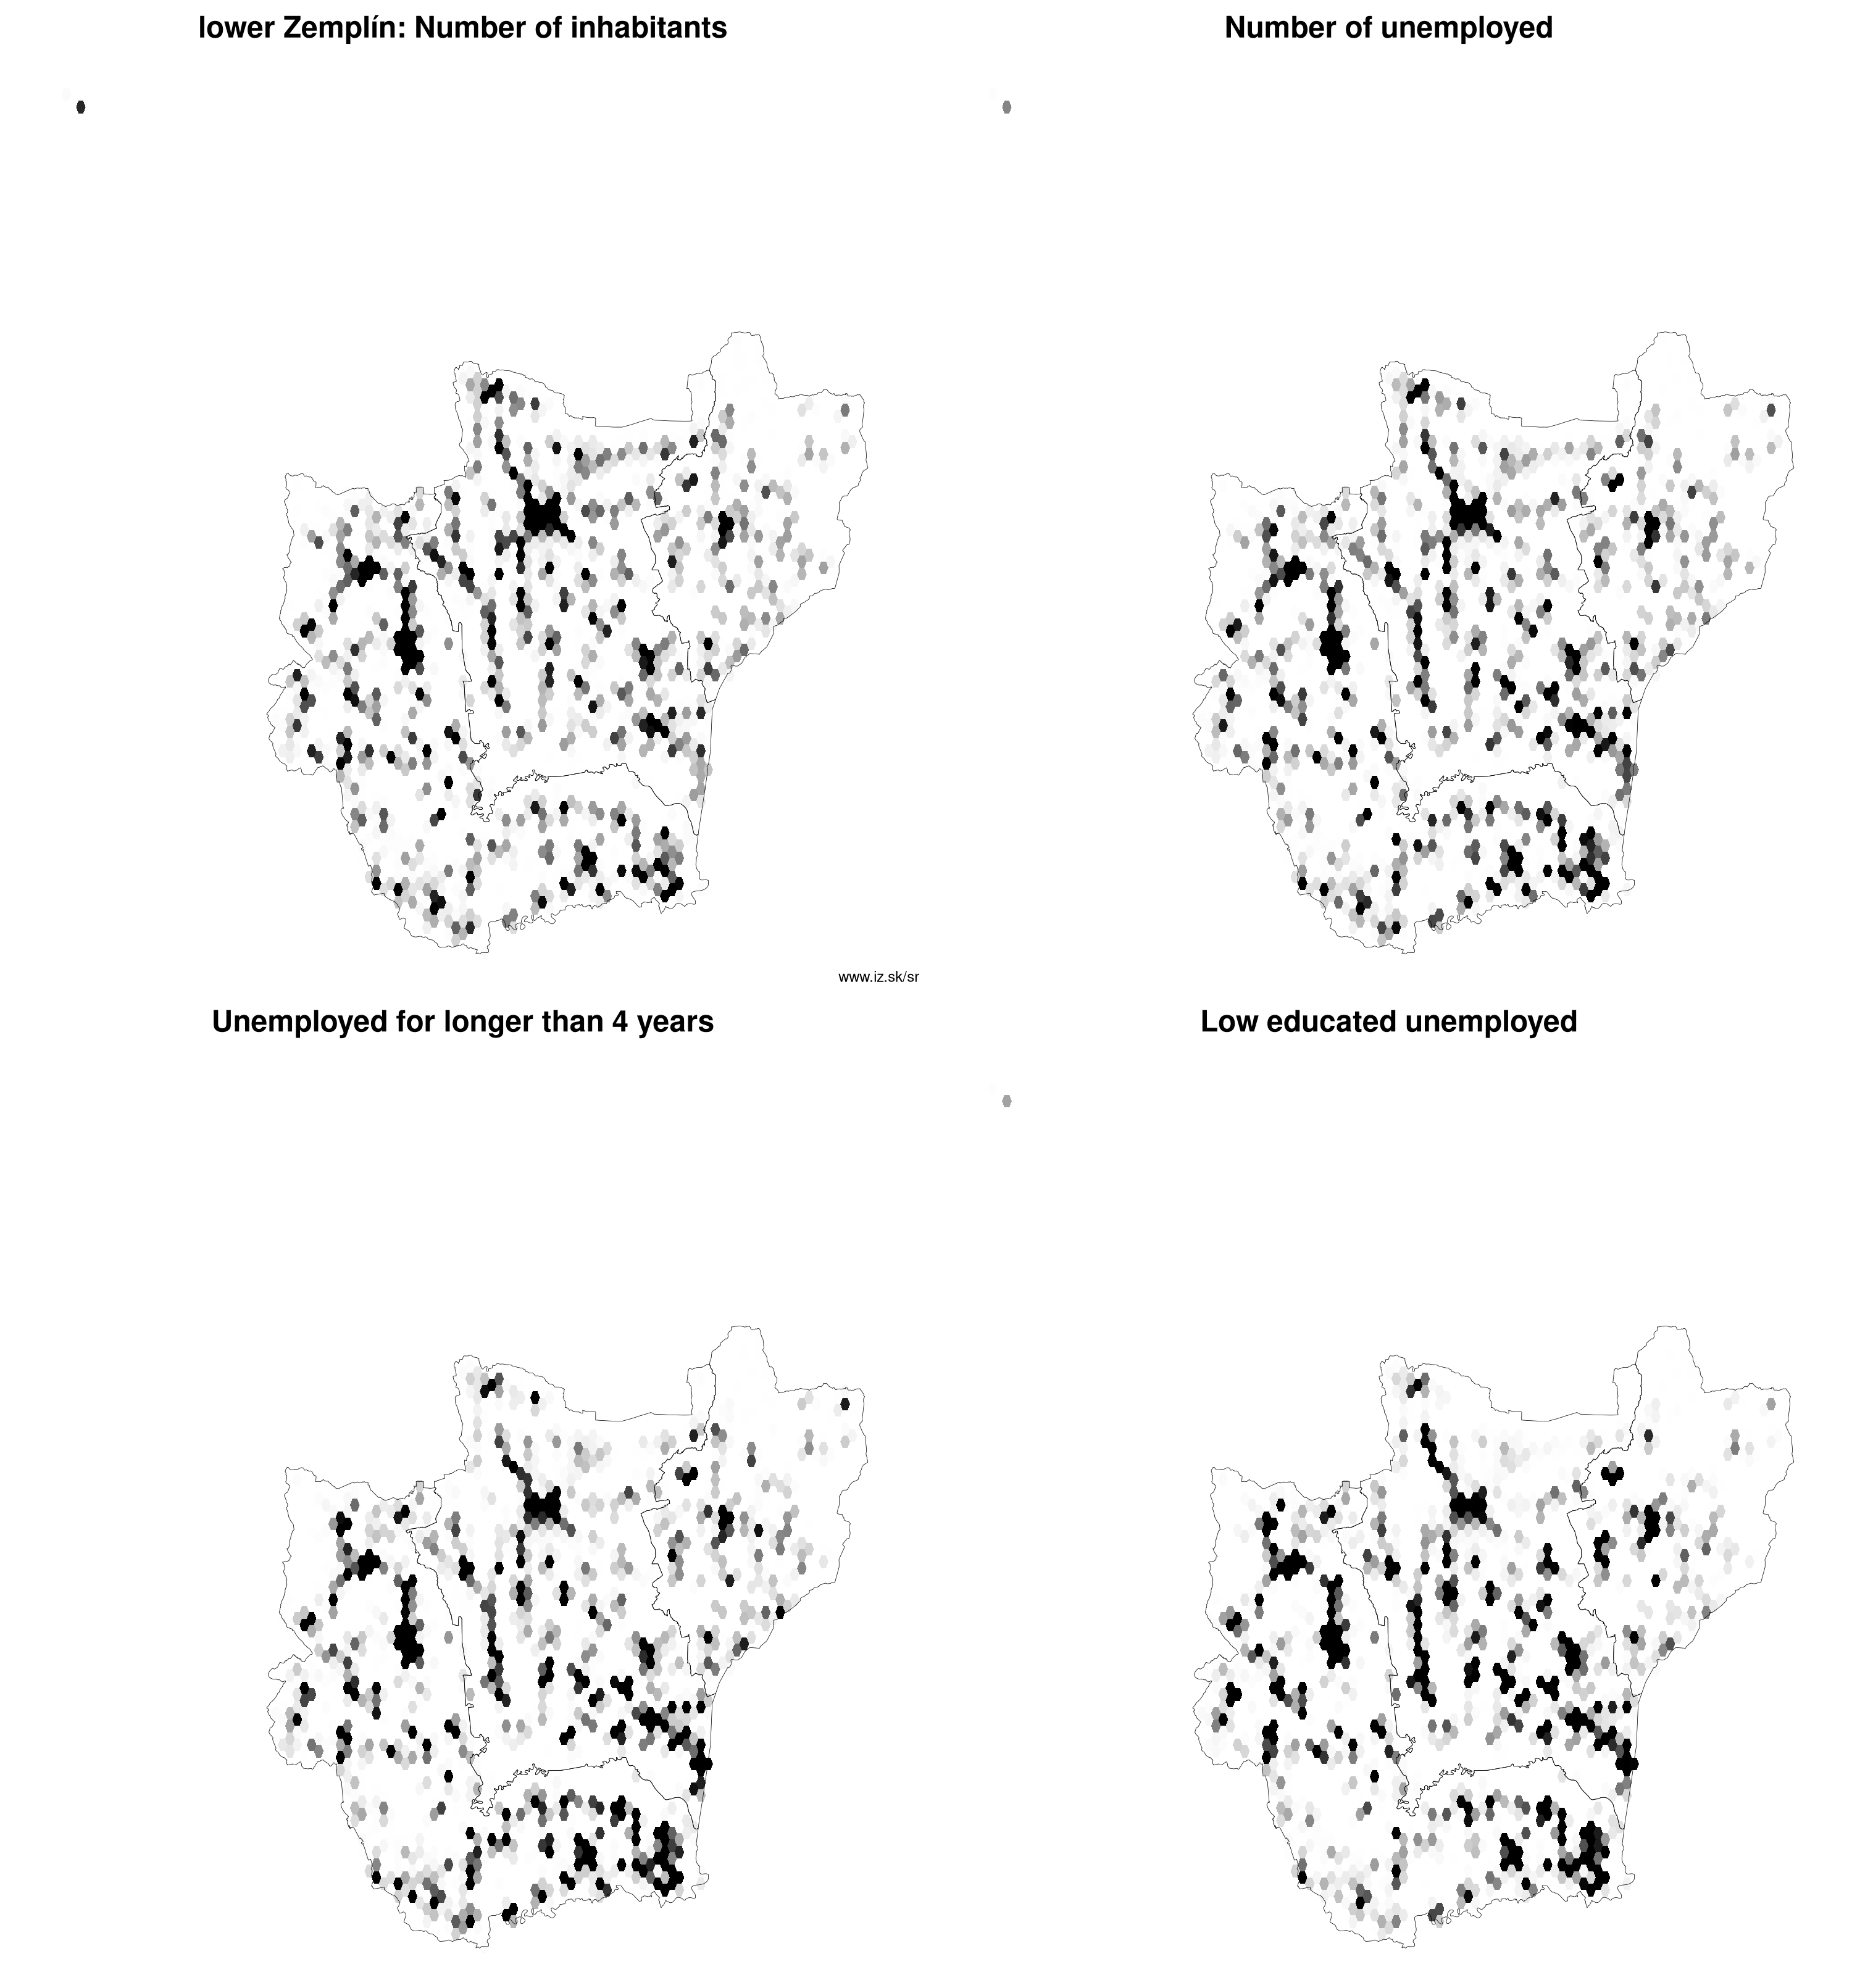
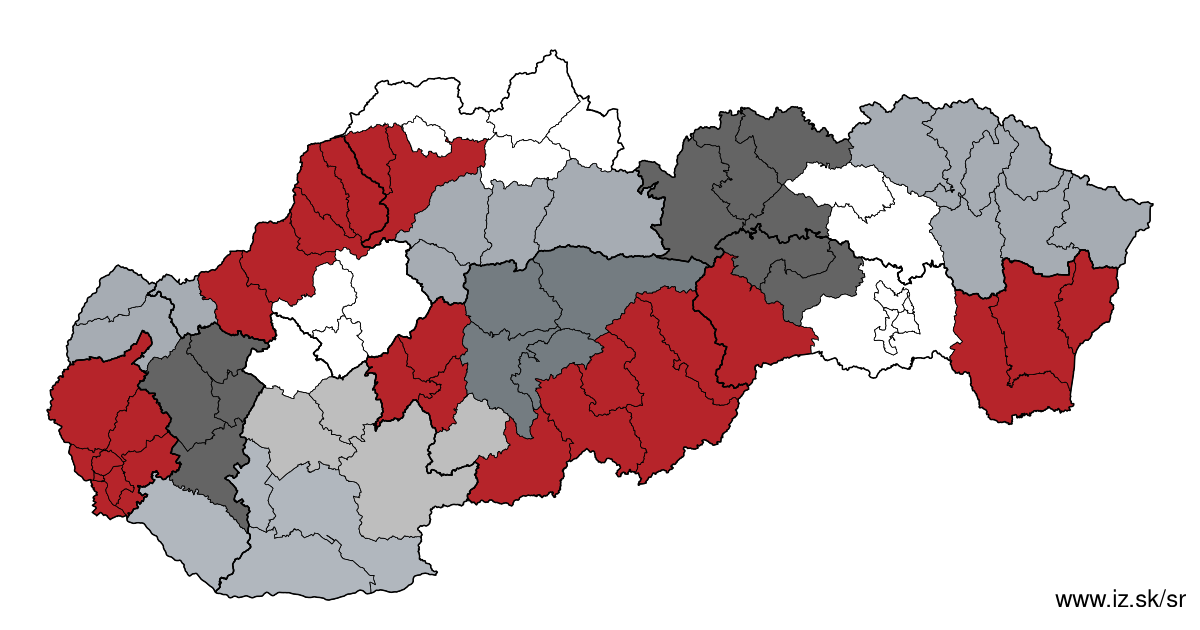
Region lower Zemplín
consists of counties:
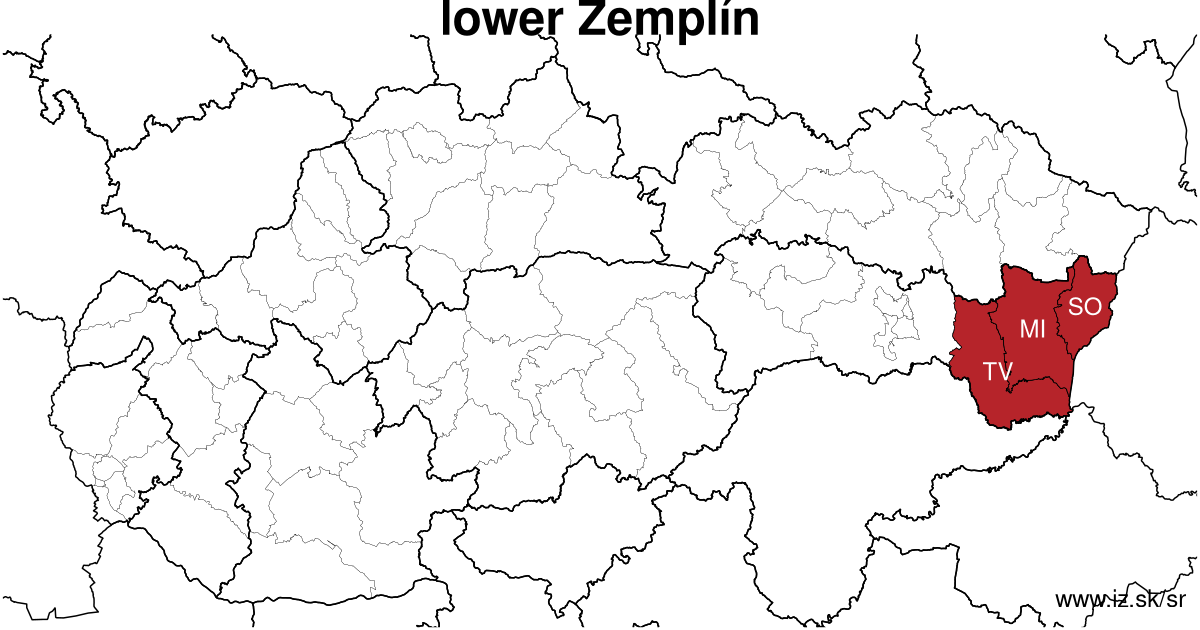
Towns
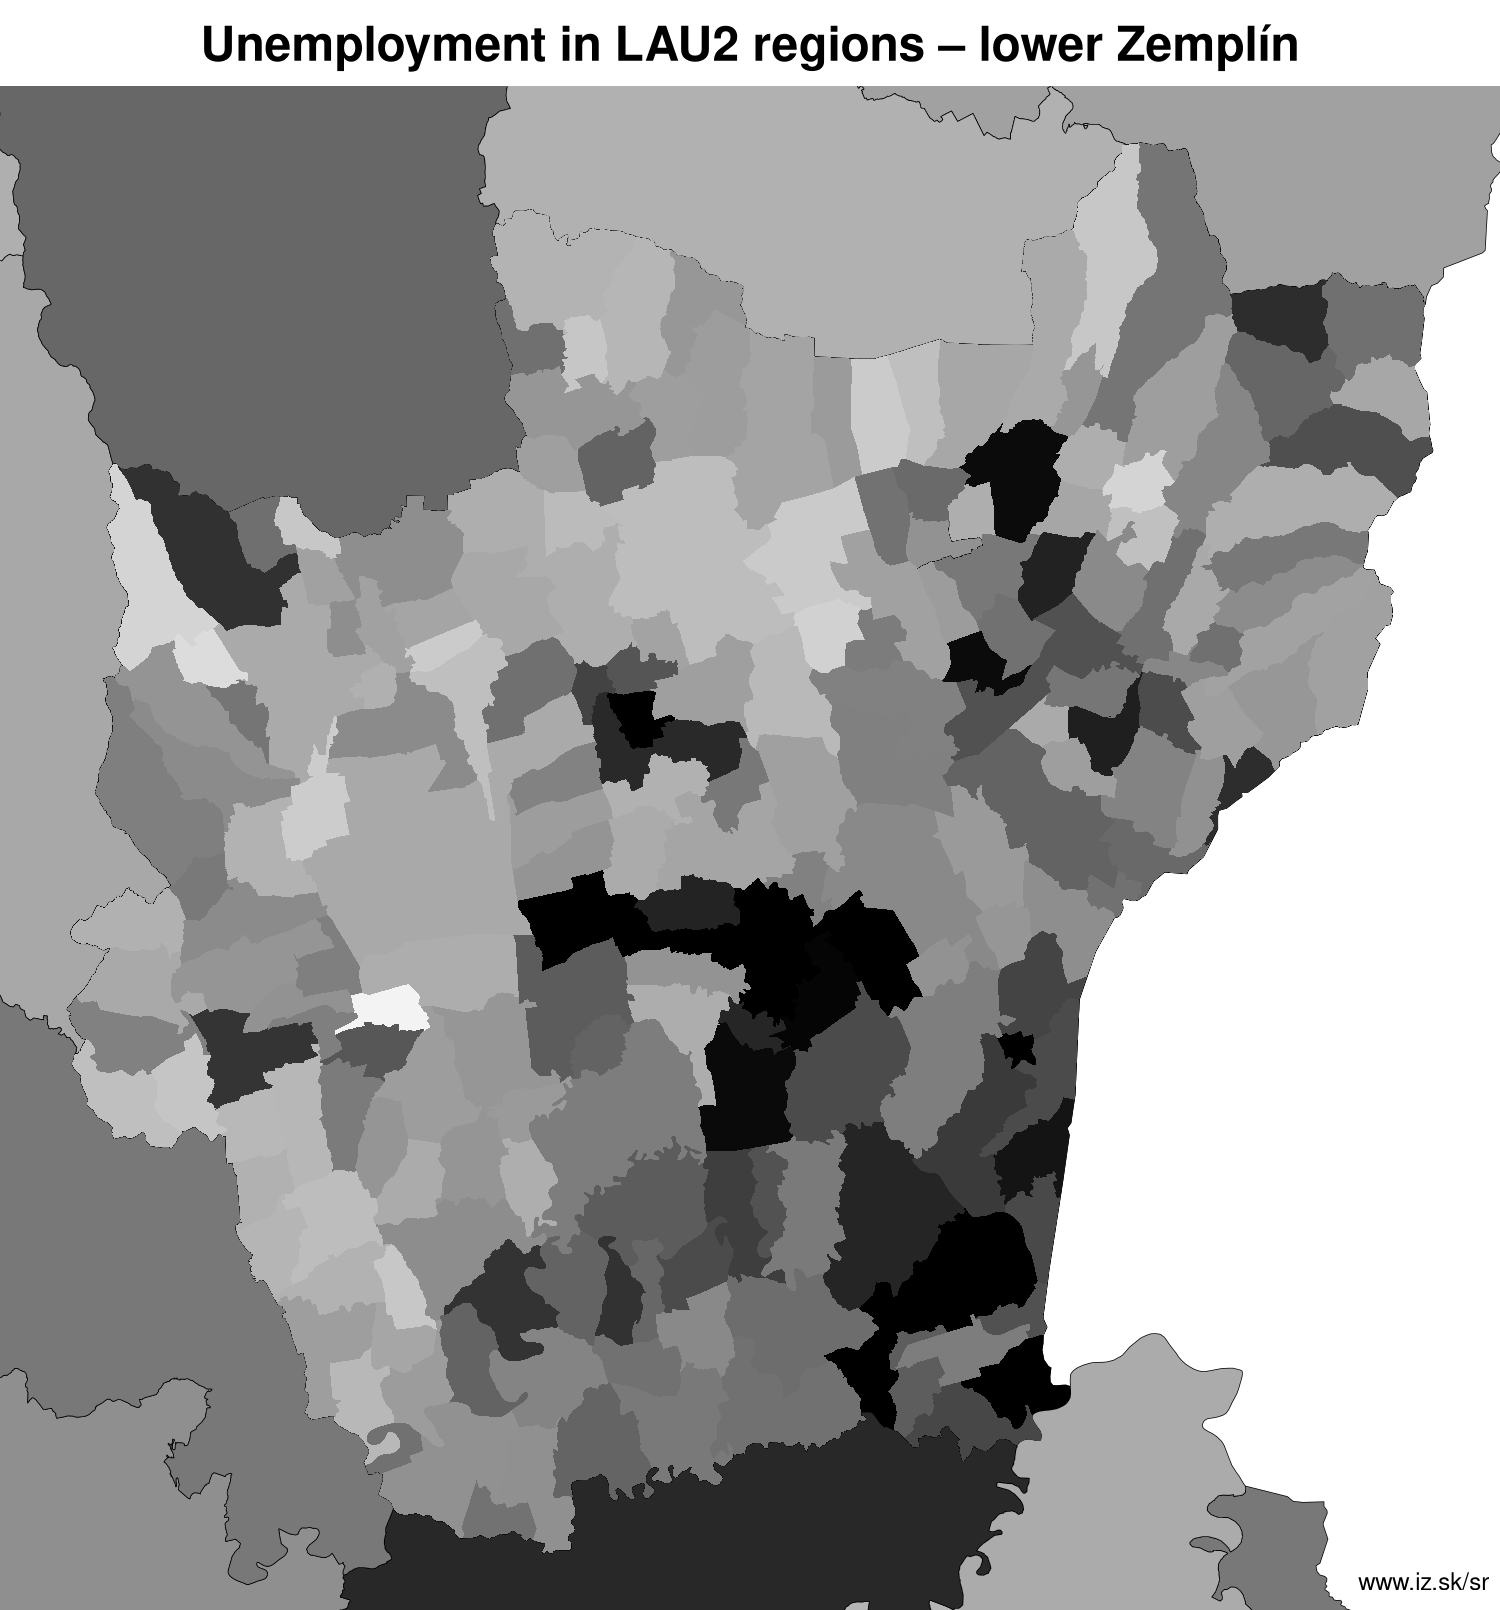
Region lower Zemplín contains cities Čierna nad Tisou, Kráľovský Chlmec, Michalovce, Sečovce, Sobrance, Strážske, Trebišov, Veľké Kapušany and 199 villages. More on oma.sk. Statistics on city level on unemployment are for the period of 2026-06-01, for population are fore yar 2025.
name | number of inhabitants in economically active age | number of unemployed number of unemployed women number of long-term unemployed | unemployment rate unemployment rate of women long-term unemployment rate |
|---|---|---|---|
 Michalovce | 34 894 22 937 | 990 506 397 | 4.3 % 4.4 % 1.7 % |
 Trebišov | 22 706 14 625 | 795 436 432 | 5.4 % 6 % 3 % |
 Sečovce | 8 509 5 392 | 350 190 159 | 6.5 % 7.1 % 2.9 % |
 Veľké Kapušany | 8 285 5 572 | 476 258 261 | 8.5 % 9.1 % 4.7 % |
 Kráľovský Chlmec | 7 229 4 844 | 516 263 312 | 10.7 % 11 % 6.4 % |
 Sobrance | 5 748 3 724 | 314 178 156 | 8.4 % 9.7 % 4.2 % |
 Strážske | 4 169 2 853 | 128 71 57 | 4.5 % 5 % 2 % |
 Čierna nad Tisou | 3 343 2 261 | 276 157 159 | 12.2 % 14 % 7 % |
Villages with over 2000 inhabitants are Pavlovce nad Uhom (4663), Streda nad Bodrogom (2257), Vojčice (2253), Vinné (2169), Trhovište (2161), Parchovany (2001).
| villages by number of inhabitants | ||||||
|---|---|---|---|---|---|---|
| total | up to 300 | 300 to 500 | 500 to 1000 | 1000 to 1500 | over 1500 | |
| 199 | 42 | 46 | 70 | 26 | 15 | |
Unemployment
| rok | 2012 | 2014 | 2016 | 2018 | 2019 | 2020 | 2021 | 2022 | 2023 | 2024 | 2025 | 2026 |
|---|---|---|---|---|---|---|---|---|---|---|---|---|
| number of unemployed | 27 730 | 25 117 | 21 704 | 15 797 | 14 296 | 15 440 | 17 227 | 15 032 | 13 454 | 12 688 | 11 946 | 11 777 |
| number of long-term unemployed | 16 981 | 16 576 | 13 498 | 8894 | 7569 | 7699 | 9713 | 8803 | 7530 | 7133 | 6574 | 6329 |
| number of people receiving social benefits | 32 124 | 28 630 | 22 666 | 17 604 | 15 807 | 14 853 | 13 673 | 13 774 | 12 959 | 12 382 | 11 828 | 11 985 |
| number of activational workers | 6708 | 6752 | 5755 | 3923 | 3459 | 3325 | 2563 | 3005 | 1080 | 1696 | 1863 | 300 |
| unemployment rate | 16.4 | 14.9 | 13 | 9.6 | 8.8 | 9.5 | 10.9 | 9.6 | 8.7 | 8.2 | 7.8 | 7.7 |
| long-term unemployment rate | 10.0 | 9.9 | 8.1 | 5.4 | 4.6 | 4.7 | 6.2 | 5.6 | 4.9 | 4.6 | 4.3 | 4.1 |
| vacancies | 219 | 166 | 766 | 1952 | 1986 | 1503 | 1136 | 1112 | 1086 | 1232 | 1367 | 1379 |
Demographics
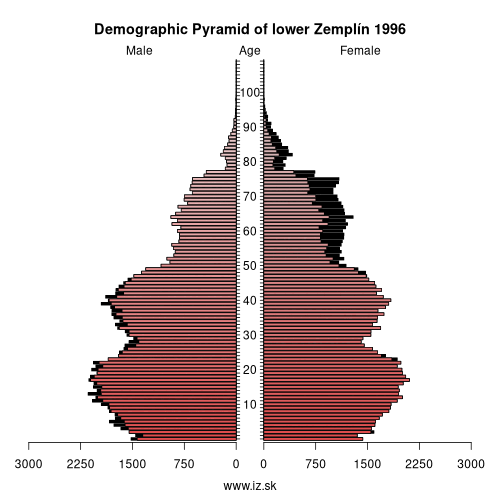
| 2012 | 2014 | 2016 | 2018 | 2019 | 2020 | 2021 | 2022 | 2023 | 2024 | 2025 | 2026 | |
|---|---|---|---|---|---|---|---|---|---|---|---|---|
| number of inhabitants | 239 883 | 239 474 | 239 406 | 238 922 | 238 832 | 238 581 | 234 274 | 233 808 | 233 360 | 233 038 | 232 412 | 232 412 |
| assignation tax | 48 078 488 | 51 565 026 | 61 835 464 | 73 956 978 | 83 265 306 | 85 719 830 | 81 897 527 | 91 492 877 | 101 128 919 | 101 215 288 | 83 457 422 | 89 915 494 |
| demographic dependency | 18.7 | 19.7 | 21.2 | 22.9 | 23.8 | 24.7 | 25.6 | 26.7 | 27.7 | 28.5 | 29.5 | |
| number of employed foreigners | 127 | 210 | 444 | 823 | 1068 | 1221 | 1057 | 1077 | 1114 | 1127 | 1221 | 1245 |
Number of unemployed
| rok | 2012 | 2014 | 2016 | 2018 | 2019 | 2020 | 2021 | 2022 | 2023 | 2024 | 2025 | 2026 |
|---|---|---|---|---|---|---|---|---|---|---|---|---|
| less than 24 years | 6172 | 4043 | 3139 | 2048 | 1850 | 2126 | 2307 | 1965 | 1802 | 1718 | 1688 | 1669 |
| 25 to 39 years | 12 017 | 9434 | 8072 | 5477 | 4947 | 5331 | 5840 | 4998 | 4422 | 4073 | 3816 | 3723 |
| 40 to 54 years | 10 903 | 8586 | 7578 | 5680 | 5078 | 5359 | 6021 | 5372 | 4817 | 4635 | 4368 | 4327 |
| 55 years and more | 3300 | 3054 | 2914 | 2591 | 2422 | 2623 | 3060 | 2697 | 2412 | 2262 | 2074 | 2081 |
Other regions
- Basic data on Slovak regions
- Labour market indicators of slovak regions.
- Region Bratislava and surroundings
- Region Kopanice
- Region Danube river
- Region lower Vah river
- Region middle Vár river
- Region upper Nitra river
- Region lower Nitra river
- Region Mining cities
- Region Kysuce a Orava
- Region upper Vah river – Liptov
- Region Spiš cities
- Region upper Hron river
- Region Juhoslovenská kotlina
- Region Košice fold and Torysa river
- Region upper Zemplín
- Region lower Zemplín
Suggested citation: Michal Páleník: Regions of Slovakia - Region lower Zemplín, IZ Bratislava, retrieved from: https://www.iz.sk/en/projects/regions-of-slovakia/lower-zemplin
Regions of the Slovak Republic
Due to the need of analysis we have created regions of Slovakia. We will bring more information about these regions from the macroeconomic point of view as well as from the point of view of the labour market.. . .
 Share
Share Facebook
 Twitter
 News
News