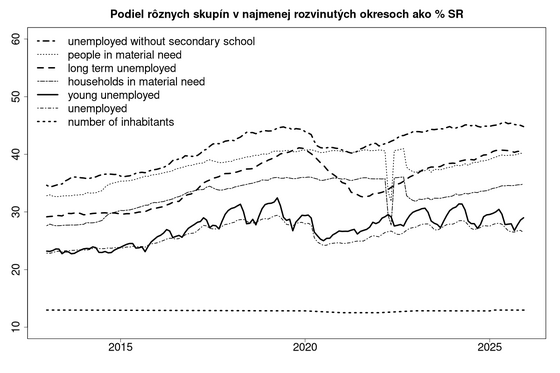
Detailed statistics of least developed regions in Slovakia
Detailed statistics of least developed regions in Slovakia from 2012 until 2025.
Number of inhabitants
| number of inhabitants – June | NRO12 | | NRO20 | | VRO | | Slovakia | |
|---|
| 2026 | 677 090 | 12.5% | 1 123 247 | 20.8% | 1 817 727 | 33.6% | 5 409 407 | 100% |
| 2025 | 677 090 | 12.5% | 1 123 247 | 20.8% | 1 817 727 | 33.6% | 5 409 407 | 100% |
| 2024 | 678 187 | 12.5% | 1 124 016 | 20.7% | 1 816 368 | 33.5% | 5 419 451 | 100% |
| 2023 | 678 494 | 12.5% | 1 123 345 | 20.7% | 1 813 643 | 33.4% | 5 424 687 | 100% |
| 2022 | 679 670 | 12.5% | 1 123 828 | 20.7% | 1 809 742 | 33.3% | 5 428 792 | 100% |
| 2021 | 680 587 | 12.5% | 1 124 194 | 20.7% | 1 806 264 | 33.2% | 5 434 712 | 100% |
| 2020 | 700 886 | 12.8% | 1 154 087 | 21.1% | 1 762 851 | 32.3% | 5 459 781 | 100% |
| 2019 | 701 319 | 12.8% | 1 153 918 | 21.1% | 1 755 346 | 32.2% | 5 457 873 | 100% |
| 2018 | 702 021 | 12.9% | 1 153 829 | 21.2% | 1 743 871 | 32% | 5 450 421 | 100% |
| 2017 | 702 382 | 12.9% | 1 152 828 | 21.2% | 1 733 820 | 31.9% | 5 443 120 | 100% |
| 2016 | 702 516 | 12.9% | 1 152 033 | 21.2% | 1 723 288 | 31.7% | 5 435 343 | 100% |
| 2015 | 702 449 | 12.9% | 1 150 528 | 21.2% | 1 713 098 | 31.6% | 5 426 252 | 100% |
| 2014 | 702 939 | 13% | 1 150 202 | 21.2% | 1 704 044 | 31.4% | 5 421 349 | 100% |
| 2013 | 702 854 | 13% | 1 149 429 | 21.2% | 1 696 149 | 31.3% | 5 415 949 | 100% |
| 2012 | 702 715 | 13% | 1 148 445 | 21.2% | 1 689 189 | 31.2% | 5 410 836 | 100% |
Number of unemployed
| number of unemployed – June | NRO12 | | NRO20 | | VRO | | Slovakia | |
|---|
| 2026 | 44 957 | 26.8% | 65 350 | 38.9% | 34 646 | 20.6% | 167 902 | 100% |
| 2025 | 44 471 | 27.3% | 65 090 | 40% | 32 489 | 20% | 162 785 | 100% |
| 2024 | 46 072 | 27.7% | 68 012 | 40.9% | 32 177 | 19.4% | 166 094 | 100% |
| 2023 | 47 449 | 27.5% | 70 659 | 41% | 32 687 | 19% | 172 233 | 100% |
| 2022 | 49 363 | 26.4% | 74 912 | 40% | 36 313 | 19.4% | 187 122 | 100% |
| 2021 | 57 213 | 24.9% | 87 355 | 38.1% | 48 383 | 21.1% | 229 394 | 100% |
| 2020 | 55 160 | 24.5% | 83 088 | 36.8% | 46 864 | 20.8% | 225 508 | 100% |
| 2019 | 47 290 | 28.5% | 70 844 | 42.7% | 29 137 | 17.6% | 166 012 | 100% |
| 2018 | 51 541 | 28.4% | 77 440 | 42.7% | 30 022 | 16.5% | 181 447 | 100% |
| 2017 | 60 253 | 27.1% | 91 577 | 41.3% | 37 432 | 16.9% | 221 933 | 100% |
| 2016 | 76 021 | 25.4% | 113 920 | 38% | 53 826 | 18% | 299 427 | 100% |
| 2015 | 84 814 | 24% | 126 821 | 35.8% | 66 290 | 18.7% | 353 844 | 100% |
| 2014 | 91 017 | 23.7% | 135 419 | 35.2% | 73 587 | 19.1% | 384 825 | 100% |
| 2013 | 96 403 | 23.1% | 143 736 | 34.4% | 79 705 | 19.1% | 418 168 | 100% |
| 2012 | 93 457 | 23.6% | 139 535 | 35.3% | 71 315 | 18% | 395 736 | 100% |
Number of people receiving social benefits
| number of people receiving social benefits – June | NRO12 | | NRO20 | | VRO | | Slovakia | |
|---|
| 2026 | 50 066 | 40.3% | 71 189 | 57.4% | 9552 | 7.7% | 124 119 | 100% |
| 2025 | 48 450 | 39.8% | 68 811 | 56.5% | 10 529 | 8.6% | 121 776 | 100% |
| 2024 | 50 204 | 38.1% | 71 875 | 54.5% | 13 767 | 10.4% | 131 770 | 100% |
| 2023 | 50 514 | 36.9% | 73 214 | 53.5% | 15 552 | 11.4% | 136 930 | 100% |
| 2022 | 53 123 | 40.7% | 76 624 | 58.6% | 8340 | 6.4% | 130 672 | 100% |
| 2021 | 50 373 | 40.5% | 72 534 | 58.3% | 8218 | 6.6% | 124 448 | 100% |
| 2020 | 57 048 | 40.3% | 82 566 | 58.3% | 9035 | 6.4% | 141 541 | 100% |
| 2019 | 58 744 | 40.6% | 85 307 | 58.9% | 9106 | 6.3% | 144 755 | 100% |
| 2018 | 64 378 | 39.6% | 93 828 | 57.7% | 10 906 | 6.7% | 162 751 | 100% |
| 2017 | 77 474 | 39.1% | 112 242 | 56.6% | 13 889 | 7% | 198 374 | 100% |
| 2016 | 84 697 | 37.2% | 122 488 | 53.7% | 18 038 | 7.9% | 227 951 | 100% |
| 2015 | 95 473 | 35.7% | 137 330 | 51.3% | 24 077 | 9% | 267 655 | 100% |
| 2014 | 111 276 | 33.6% | 161 456 | 48.7% | 34 110 | 10.3% | 331 652 | 100% |
| 2013 | 118 820 | 32.8% | 173 392 | 47.8% | 38 448 | 10.6% | 362 767 | 100% |
| 2012 | 116 453 | 32.5% | 170 356 | 47.5% | 37 989 | 10.6% | 358 335 | 100% |
Number of activational workers
| number of activational workers – June | NRO12 | | NRO20 | | VRO | | Slovakia | |
|---|
| 2025 | 7566 | 57.9% | 10 274 | 78.6% | 123 | 0.9% | 13 065 | 100% |
| 2024 | 8054 | 58.1% | 10 828 | 78.2% | 132 | 1% | 13 853 | 100% |
| 2023 | 1118 | 77.7% | 1366 | 94.9% | 0 | 0% | 1439 | 100% |
| 2022 | 11 965 | 57.4% | 16 523 | 79.3% | 242 | 1.2% | 20 849 | 100% |
| 2021 | 11 471 | 57.7% | 15 591 | 78.5% | 299 | 1.5% | 19 873 | 100% |
| 2020 | 11 068 | 58.1% | 15 296 | 80.3% | 302 | 1.6% | 19 043 | 100% |
| 2019 | 12 500 | 56.7% | 17 316 | 78.5% | 292 | 1.3% | 22 045 | 100% |
| 2018 | 13 797 | 54% | 19 415 | 76.1% | 423 | 1.7% | 25 527 | 100% |
| 2017 | 18 449 | 52.3% | 25 631 | 72.6% | 817 | 2.3% | 35 285 | 100% |
| 2016 | 23 003 | 52.7% | 31 277 | 71.7% | 1126 | 2.6% | 43 631 | 100% |
| 2015 | 27 462 | 52.2% | 36 740 | 69.8% | 1640 | 3.1% | 52 650 | 100% |
| 2014 | 29 705 | 51.1% | 40 213 | 69.1% | 1952 | 3.4% | 58 166 | 100% |
| 2013 | 32 671 | 55.7% | 42 405 | 72.2% | 1854 | 3.2% | 58 700 | 100% |
| 2012 | 33 048 | 55.2% | 43 192 | 72.2% | 1921 | 3.2% | 59 835 | 100% |
Unemployment rate
| unemployment rate – June | NRO12 | | NRO20 | | VRO | | Slovakia | |
|---|
| 2026 | 10.2 | 212.5% | 8.9 | 185.4% | 2.9 | 60.4% | 4.8 | 100% |
| 2025 | 10.1 | 219.6% | 8.9 | 193.5% | 2.7 | 58.7% | 4.6 | 100% |
| 2024 | 10.4 | 221.3% | 9.2 | 195.7% | 2.7 | 57.4% | 4.7 | 100% |
| 2023 | 10.6 | 220.8% | 9.5 | 197.9% | 2.8 | 58.3% | 4.8 | 100% |
| 2022 | 11 | 211.5% | 10.1 | 194.2% | 3.1 | 59.6% | 5.2 | 100% |
| 2021 | 12.6 | 200% | 11.6 | 184.1% | 4 | 63.5% | 6.3 | 100% |
| 2020 | 11.7 | 188.7% | 10.7 | 172.6% | 4 | 64.5% | 6.2 | 100% |
| 2019 | 10 | 222.2% | 9.1 | 202.2% | 2.5 | 55.6% | 4.5 | 100% |
| 2018 | 10.8 | 220.4% | 9.9 | 202% | 2.5 | 51% | 4.9 | 100% |
| 2017 | 12.5 | 211.9% | 11.6 | 196.6% | 3.2 | 54.2% | 5.9 | 100% |
| 2016 | 15.7 | 198.7% | 14.3 | 181% | 4.5 | 57% | 7.9 | 100% |
| 2015 | 17.4 | 187.1% | 15.9 | 171% | 5.5 | 59.1% | 9.3 | 100% |
| 2014 | 18.6 | 186% | 16.9 | 169% | 6.1 | 61% | 10 | 100% |
| 2013 | 19.6 | 179.8% | 17.9 | 164.2% | 6.6 | 60.6% | 10.9 | 100% |
| 2012 | 19 | 186.3% | 17.3 | 169.6% | 5.9 | 57.8% | 10.2 | 100% |
Unemployment rate in comparisson to country level
| unemployment rate in comparisson to country level – June | NRO12 | | NRO20 | | VRO | | Slovakia | |
|---|
| 2026 | 2.14 | 214% | 1.87 | 187% | 0.62 | 62% | 1.00 | 100% |
| 2025 | 2.18 | 218% | 1.92 | 192% | 0.60 | 60% | 1.00 | 100% |
| 2024 | 2.21 | 221% | 1.97 | 197% | 0.58 | 58% | 1.00 | 100% |
| 2023 | 2.20 | 220% | 1.97 | 197% | 0.57 | 57% | 1.00 | 100% |
| 2022 | 2.10 | 210% | 1.93 | 193% | 0.59 | 59% | 1.00 | 100% |
| 2021 | 1.99 | 199% | 1.84 | 184% | 0.64 | 64% | 1.00 | 100% |
| 2020 | 1.90 | 190% | 1.74 | 174% | 0.65 | 65% | 1.00 | 100% |
| 2019 | 2.22 | 222% | 2.01 | 201% | 0.55 | 55% | 1.00 | 100% |
| 2018 | 2.21 | 221% | 2.02 | 202% | 0.52 | 52% | 1.00 | 100% |
| 2017 | 2.12 | 212% | 1.96 | 196% | 0.53 | 53% | 1.00 | 100% |
| 2016 | 1.98 | 198% | 1.81 | 181% | 0.57 | 57% | 1.00 | 100% |
| 2015 | 1.87 | 187% | 1.71 | 171% | 0.59 | 59% | 1.00 | 100% |
| 2014 | 1.85 | 185% | 1.68 | 168% | 0.61 | 61% | 1.00 | 100% |
| 2013 | 1.81 | 181% | 1.65 | 165% | 0.61 | 61% | 1.00 | 100% |
| 2012 | 1.86 | 186% | 1.70 | 170% | 0.57 | 57% | 1.00 | 100% |
Number of long-term unemployed
| number of long-term unemployed – June | NRO12 | | NRO20 | | VRO | | Slovakia | |
|---|
| 2026 | 24 806 | 40.1% | 34 784 | 56.3% | 6043 | 9.8% | 61 834 | 100% |
| 2025 | 25 144 | 40.7% | 35 430 | 57.3% | 5561 | 9% | 61 796 | 100% |
| 2024 | 26 184 | 39% | 37 447 | 55.8% | 6387 | 9.5% | 67 098 | 100% |
| 2023 | 26 665 | 37.8% | 38 567 | 54.7% | 7517 | 10.7% | 70 535 | 100% |
| 2022 | 28 688 | 34.5% | 42 504 | 51.2% | 10 503 | 12.6% | 83 035 | 100% |
| 2021 | 31 832 | 33% | 46 974 | 48.7% | 13 851 | 14.4% | 96 422 | 100% |
| 2020 | 25 042 | 38.5% | 36 307 | 55.9% | 6201 | 9.5% | 64 977 | 100% |
| 2019 | 24 196 | 40.2% | 35 154 | 58.4% | 4768 | 7.9% | 60 179 | 100% |
| 2018 | 27 825 | 37.5% | 41 174 | 55.4% | 6256 | 8.4% | 74 290 | 100% |
| 2017 | 37 547 | 35.5% | 55 005 | 52.1% | 10 405 | 9.8% | 105 654 | 100% |
| 2016 | 48 117 | 31.7% | 69 751 | 45.9% | 18 606 | 12.2% | 151 932 | 100% |
| 2015 | 56 681 | 29.9% | 81 533 | 43% | 26 321 | 13.9% | 189 817 | 100% |
| 2014 | 62 360 | 29.8% | 89 612 | 42.8% | 29 461 | 14.1% | 209 363 | 100% |
| 2013 | 63 218 | 29.3% | 91 062 | 42.2% | 29 401 | 13.6% | 215 655 | 100% |
| 2012 | 58 790 | 29.7% | 84 356 | 42.6% | 25 707 | 13% | 198 201 | 100% |
Long-term unemployment rate
| long-term unemployment rate – June | NRO12 | | NRO20 | | VRO | | Slovakia | |
|---|
| 2026 | 5.6 | 311.1% | 4.7 | 261.1% | 0.5 | 27.8% | 1.8 | 100% |
| 2025 | 5.7 | 316.7% | 4.8 | 266.7% | 0.5 | 27.8% | 1.8 | 100% |
| 2024 | 5.9 | 310.5% | 5.1 | 268.4% | 0.5 | 26.3% | 1.9 | 100% |
| 2023 | 6.0 | 300% | 5.2 | 260% | 0.6 | 30% | 2.0 | 100% |
| 2022 | 6.4 | 278.3% | 5.7 | 247.8% | 0.9 | 39.1% | 2.3 | 100% |
| 2021 | 7.0 | 259.3% | 6.3 | 233.3% | 1.2 | 44.4% | 2.7 | 100% |
| 2020 | 5.3 | 294.4% | 4.7 | 261.1% | 0.5 | 27.8% | 1.8 | 100% |
| 2019 | 5.1 | 318.7% | 4.5 | 281.3% | 0.4 | 25% | 1.6 | 100% |
| 2018 | 5.8 | 290% | 5.2 | 260% | 0.5 | 25% | 2.0 | 100% |
| 2017 | 7.8 | 278.6% | 7.0 | 250% | 0.9 | 32.1% | 2.8 | 100% |
| 2016 | 9.9 | 247.5% | 8.8 | 220% | 1.6 | 40% | 4.0 | 100% |
| 2015 | 11.6 | 232% | 10.2 | 204% | 2.2 | 44% | 5.0 | 100% |
| 2014 | 12.7 | 230.9% | 11.2 | 203.6% | 2.4 | 43.6% | 5.5 | 100% |
| 2013 | 12.9 | 230.4% | 11.3 | 201.8% | 2.4 | 42.9% | 5.6 | 100% |
| 2012 | 12.0 | 235.3% | 10.5 | 205.9% | 2.1 | 41.2% | 5.1 | 100% |
Long-term unemployment rate in comparisson to country level
| long-term unemployment rate in comparisson to country level – June | NRO12 | | NRO20 | | VRO | | Slovakia | |
|---|
| 2026 | 3.20 | 320% | 2.70 | 270% | 0.29 | 29% | 1.00 | 100% |
| 2025 | 3.25 | 325% | 2.75 | 275% | 0.27 | 27% | 1.00 | 100% |
| 2024 | 3.11 | 311% | 2.68 | 268% | 0.29 | 29% | 1.00 | 100% |
| 2023 | 3.02 | 302% | 2.63 | 263% | 0.32 | 32% | 1.00 | 100% |
| 2022 | 2.76 | 276% | 2.46 | 246% | 0.38 | 38% | 1.00 | 100% |
| 2021 | 2.63 | 263% | 2.35 | 235% | 0.43 | 43% | 1.00 | 100% |
| 2020 | 2.99 | 299% | 2.63 | 263% | 0.30 | 30% | 1.00 | 100% |
| 2019 | 3.13 | 313% | 2.76 | 276% | 0.25 | 25% | 1.00 | 100% |
| 2018 | 2.92 | 292% | 2.62 | 262% | 0.27 | 27% | 1.00 | 100% |
| 2017 | 2.77 | 277% | 2.47 | 247% | 0.31 | 31% | 1.00 | 100% |
| 2016 | 2.47 | 247% | 2.18 | 218% | 0.39 | 39% | 1.00 | 100% |
| 2015 | 2.33 | 233% | 2.05 | 205% | 0.44 | 44% | 1.00 | 100% |
| 2014 | 2.33 | 233% | 2.05 | 205% | 0.45 | 45% | 1.00 | 100% |
| 2013 | 2.30 | 230% | 2.02 | 202% | 0.43 | 43% | 1.00 | 100% |
| 2012 | 2.33 | 233% | 2.05 | 205% | 0.41 | 41% | 1.00 | 100% |
Working places supported by the government
| working places supported by the government – January | NRO12 | | NRO20 | | VRO | | Slovakia | |
|---|
| 2026 | | 0% | 281 | 49.9% | 277 | 49.2% | 563 | 100% |
| 2025 | 394 | 27.9% | 422 | 29.9% | 370 | 26.2% | 1410 | 100% |
| 2024 | 870 | 22.4% | 924 | 23.8% | 725 | 18.7% | 3879 | 100% |
| 2023 | 482 | 28.8% | 621 | 37.1% | | 0% | 1672 | 100% |
| 2022 | 110 | 2.5% | 3555 | 81.4% | 205 | 4.7% | 4365 | 100% |
| 2021 | 20 | 1.5% | 308 | 22.5% | | 0% | 1370 | 100% |
| 2020 | | 0% | 334 | 31.4% | 18 | 1.7% | 1065 | 100% |
| 2019 | | 0% | | 0% | 34 | 32.7% | 104 | 100% |
| 2018 | 666 | 26.7% | 666 | 26.7% | 150 | 6% | 2490 | 100% |
| 2017 | 160 | 5.7% | 203 | 7.2% | 734 | 26.1% | 2816 | 100% |
| 2016 | | 0% | 50 | 10.3% | 67 | 13.8% | 486 | 100% |
| 2015 | 100 | 2.2% | 274 | 5.9% | 0 | 0% | 4617 | 100% |
| 2014 | 516 | 39.4% | 571 | 43.6% | 319 | 24.4% | 1310 | 100% |
| 2013 | 326 | 17.7% | 756 | 41% | 467 | 25.3% | 1843 | 100% |
| 2012 | 115 | 4.8% | 727 | 30.2% | 487 | 20.2% | 2407 | 100% |
Support from the government (€)
| support from the government (€) – January | NRO12 | | NRO20 | | VRO | | Slovakia | |
|---|
| 2026 | | 0% | 28 155 722 | 49.2% | 24 332 760 | 42.5% | 57 238 482 | 100% |
| 2025 | 4 754 570 | 12.9% | 9 331 055 | 25.2% | 16 392 704 | 44.3% | 36 997 073 | 100% |
| 2024 | 24 748 572 | 7% | 25 978 458 | 7.3% | 56 813 000 | 16% | 355 257 565 | 100% |
| 2023 | 43 375 724 | 42.9% | 67 513 120 | 66.7% | | 0% | 101 150 107 | 100% |
| 2022 | 2 664 447 | 0.8% | 278 386 397 | 85.6% | 28 202 312 | 8.7% | 325 123 188 | 100% |
| 2021 | 580 000 | 1.2% | 22 258 424 | 44.2% | | 0% | 50 329 815 | 100% |
| 2020 | | 0% | 11 959 000 | 42.8% | 5 035 000 | 18% | 27 968 719 | 100% |
| 2019 | | 0% | | 0% | 2 000 000 | 40% | 5 000 000 | 100% |
| 2018 | 17 286 000 | 43.7% | 17 286 000 | 43.7% | 1 950 000 | 4.9% | 39 557 500 | 100% |
| 2017 | 6 178 913 | 4.9% | 7 253 913 | 5.7% | 24 006 586 | 18.9% | 126 881 520 | 100% |
| 2016 | | 0% | 1 400 000 | 8.8% | 1 530 000 | 9.7% | 15 830 000 | 100% |
| 2015 | 2 760 624 | 1.9% | 7 627 463 | 5.2% | 0 | 0% | 147 306 618 | 100% |
| 2014 | 13 283 000 | 14.3% | 14 933 000 | 16% | 8 847 160 | 9.5% | 93 102 032 | 100% |
| 2013 | 3 004 414 | 6.9% | 15 794 168 | 36.4% | 17 299 289 | 39.9% | 43 347 457 | 100% |
| 2012 | 3 859 000 | 3.2% | 31 359 000 | 25.9% | 33 329 270 | 27.5% | 121 191 498 | 100% |
Assignation tax
| assignation tax – January | NRO12 | | NRO20 | | VRO | | Slovakia | |
|---|
| 2026 | 278 255 753 | 12.1% | 461 691 970 | 20.1% | 876 926 406 | 38.1% | 2 300 453 938 | 100% |
| 2025 | 257 750 233 | 12.1% | 426 952 120 | 20% | 812 305 513 | 38.1% | 2 133 624 583 | 100% |
| 2024 | 318 000 803 | 12.2% | 524 153 690 | 20.2% | 978 684 216 | 37.7% | 2 598 855 026 | 100% |
| 2023 | 315 885 522 | 12.2% | 522 031 719 | 20.2% | 972 378 184 | 37.6% | 2 588 941 771 | 100% |
| 2022 | 285 652 659 | 12.4% | 471 002 947 | 20.5% | 843 457 280 | 36.8% | 2 294 837 830 | 100% |
| 2021 | 255 834 492 | 12.4% | 421 750 721 | 20.4% | 757 641 799 | 36.7% | 2 064 545 732 | 100% |
| 2020 | 266 510 580 | 12.4% | 438 770 352 | 20.5% | 781 872 909 | 36.5% | 2 143 772 368 | 100% |
| 2019 | 258 787 106 | 12.5% | 425 408 905 | 20.5% | 751 325 060 | 36.3% | 2 071 740 457 | 100% |
| 2018 | 229 268 754 | 12.5% | 376 592 363 | 20.6% | 659 424 327 | 36.1% | 1 828 469 854 | 100% |
| 2017 | 214 173 435 | 12.8% | 351 542 470 | 20.9% | 595 776 826 | 35.5% | 1 678 279 026 | 100% |
| 2016 | 192 043 964 | 12.8% | 314 592 118 | 21% | 527 426 412 | 35.2% | 1 496 730 556 | 100% |
| 2015 | 176 260 787 | 12.9% | 288 377 776 | 21% | 481 311 222 | 35.1% | 1 371 366 031 | 100% |
| 2014 | 159 712 305 | 12.9% | 261 249 593 | 21.1% | 432 105 141 | 34.9% | 1 237 715 916 | 100% |
| 2013 | 153 129 021 | 12.8% | 250 611 164 | 21% | 419 778 302 | 35.1% | 1 195 486 577 | 100% |
| 2012 | 151 744 814 | 12.6% | 247 645 091 | 20.6% | 421 795 337 | 35.2% | 1 199 896 640 | 100% |
Demographic dependency
| demographic dependency – January | NRO12 | | NRO20 | | VRO | | Slovakia | |
|---|
| 2025 | 28.7 | 89.4% | 28.6 | 89.1% | 32.7 | 101.9% | 32.1 | 100% |
| 2024 | 27.7 | 88.8% | 27.7 | 88.8% | 31.8 | 101.9% | 31.2 | 100% |
| 2023 | 26.9 | 89.1% | 26.8 | 88.7% | 31 | 102.6% | 30.2 | 100% |
| 2022 | 25.9 | 88.7% | 25.8 | 88.4% | 30 | 102.7% | 29.2 | 100% |
| 2021 | 25 | 88.7% | 24.9 | 88.3% | 29 | 102.8% | 28.2 | 100% |
| 2020 | 24.5 | 89.4% | 24.3 | 88.7% | 28.4 | 103.6% | 27.4 | 100% |
| 2019 | 23.6 | 89.4% | 23.5 | 89% | 27.4 | 103.8% | 26.4 | 100% |
| 2018 | 22.7 | 89.7% | 22.6 | 89.3% | 26.3 | 104% | 25.3 | 100% |
| 2017 | 21.9 | 90.1% | 21.8 | 89.7% | 25.2 | 103.7% | 24.3 | 100% |
| 2016 | 21 | 90.1% | 21 | 90.1% | 24.2 | 103.9% | 23.3 | 100% |
| 2015 | 20.3 | 91.4% | 20.2 | 91% | 23.1 | 104.1% | 22.2 | 100% |
| 2014 | 19.6 | 91.6% | 19.6 | 91.6% | 22.2 | 103.7% | 21.4 | 100% |
| 2013 | 19 | 92.2% | 19 | 92.2% | 21.5 | 104.4% | 20.6 | 100% |
| 2012 | 18.6 | 93% | 18.5 | 92.5% | 20.8 | 104% | 20 | 100% |
Number of employed foreigners
| number of employed foreigners – June | NRO12 | | NRO20 | | VRO | | Slovakia | |
|---|
| 2026 | 2895 | 1.9% | 5240 | 3.5% | 105 577 | 69.9% | 150 962 | 100% |
| 2025 | 3245 | 2.6% | 5353 | 4.2% | 86 391 | 68.1% | 126 827 | 100% |
| 2024 | 3648 | 3.4% | 5663 | 5.3% | 69 772 | 64.9% | 107 536 | 100% |
| 2023 | 3459 | 3.6% | 5217 | 5.4% | 62 217 | 64% | 97 263 | 100% |
| 2022 | 3206 | 4% | 4786 | 5.9% | 49 969 | 62.1% | 80 492 | 100% |
| 2021 | 2452 | 3.6% | 3862 | 5.7% | 44 227 | 64.7% | 68 316 | 100% |
| 2020 | 1898 | 2.6% | 3485 | 4.7% | 49 911 | 67.2% | 74 298 | 100% |
| 2019 | 1925 | 2.6% | 3560 | 4.9% | 50 685 | 69.4% | 73 080 | 100% |
| 2018 | 1591 | 2.7% | 2796 | 4.8% | 40 648 | 70.1% | 57 998 | 100% |
| 2017 | 1133 | 2.7% | 1962 | 4.6% | 28 658 | 67.6% | 42 405 | 100% |
| 2016 | 1371 | 4.5% | 2025 | 6.7% | 18 359 | 60.7% | 30 222 | 100% |
| 2015 | 1442 | 6.3% | 1961 | 8.6% | 13 052 | 57.1% | 22 865 | 100% |
| 2014 | 1000 | 5.9% | 1437 | 8.4% | 9697 | 56.9% | 17 028 | 100% |
| 2013 | 231 | 1.9% | 397 | 3.2% | 8590 | 69% | 12 444 | 100% |
| 2012 | 192 | 1.7% | 353 | 3.2% | 7476 | 66.7% | 11 206 | 100% |
Vacancies
| vacancies – June | NRO12 | | NRO20 | | VRO | | Slovakia | |
|---|
| 2026 | 2090 | 1.4% | 4847 | 3.2% | 102 856 | 67.3% | 152 862 | 100% |
| 2025 | 2111 | 2% | 4044 | 3.8% | 76 583 | 71.5% | 107 044 | 100% |
| 2024 | 2338 | 2.4% | 4347 | 4.4% | 61 088 | 62.1% | 98 423 | 100% |
| 2023 | 1924 | 2.4% | 3353 | 4.2% | 49 234 | 62.4% | 78 932 | 100% |
| 2022 | 3037 | 3.7% | 4939 | 6.1% | 47 171 | 58.2% | 81 012 | 100% |
| 2021 | 3061 | 4.2% | 5529 | 7.5% | 40 779 | 55.5% | 73 447 | 100% |
| 2020 | 2733 | 4% | 5072 | 7.5% | 38 135 | 56% | 68 045 | 100% |
| 2019 | 3734 | 4% | 7537 | 8.1% | 52 487 | 56.2% | 93 420 | 100% |
| 2018 | 3442 | 4.2% | 6314 | 7.7% | 49 613 | 60.2% | 82 391 | 100% |
| 2017 | 3526 | 5.7% | 6410 | 10.3% | 34 079 | 55% | 61 995 | 100% |
| 2016 | 2369 | 5.7% | 4710 | 11.2% | 20 630 | 49.2% | 41 929 | 100% |
| 2015 | 1748 | 6.6% | 2898 | 11% | 12 185 | 46.3% | 26 309 | 100% |
| 2014 | 781 | 8.5% | 1271 | 13.8% | 4055 | 44% | 9215 | 100% |
| 2013 | 489 | 7.9% | 1150 | 18.6% | 2311 | 37.4% | 6181 | 100% |
Less than 24 years
| less than 24 years – May | NRO12 | | NRO20 | | VRO | | Slovakia | |
|---|
| 2026 | 6484 | 29.2% | 9529 | 43% | 3797 | 17.1% | 22 171 | 100% |
| 2025 | 6145 | 29.6% | 9049 | 43.6% | 3484 | 16.8% | 20 748 | 100% |
| 2024 | 6370 | 30.4% | 9457 | 45.1% | 3255 | 15.5% | 20 978 | 100% |
| 2023 | 6354 | 29.9% | 9640 | 45.4% | 3187 | 15% | 21 218 | 100% |
| 2022 | 6600 | 29.1% | 10 329 | 45.6% | 3425 | 15.1% | 22 654 | 100% |
| 2021 | 7768 | 27% | 12 259 | 42.6% | 4835 | 16.8% | 28 787 | 100% |
| 2020 | 7648 | 25.9% | 11 790 | 39.9% | 5244 | 17.7% | 29 547 | 100% |
| 2019 | 6379 | 31.1% | 9803 | 47.8% | 2783 | 13.6% | 20 496 | 100% |
| 2018 | 6829 | 30.1% | 10 458 | 46.1% | 3181 | 14% | 22 710 | 100% |
| 2017 | 9175 | 28.6% | 14 234 | 44.4% | 4636 | 14.5% | 32 077 | 100% |
| 2016 | 11 713 | 26.7% | 17 876 | 40.8% | 7132 | 16.3% | 43 866 | 100% |
| 2015 | 13 788 | 24.5% | 20 851 | 37.1% | 9906 | 17.6% | 56 220 | 100% |
| 2014 | 15 730 | 23.8% | 23 633 | 35.8% | 12 358 | 18.7% | 66 072 | 100% |
25 to 39 years
| 25 to 39 years – May | NRO12 | | NRO20 | | VRO | | Slovakia | |
|---|
| 2026 | 14 843 | 27.5% | 21 558 | 40% | 11 303 | 21% | 53 945 | 100% |
| 2025 | 15 062 | 27.7% | 21 996 | 40.4% | 11 385 | 20.9% | 54 451 | 100% |
| 2024 | 15 808 | 28.1% | 23 262 | 41.3% | 11 351 | 20.1% | 56 334 | 100% |
| 2023 | 16 264 | 28.1% | 24 196 | 41.9% | 11 366 | 19.7% | 57 785 | 100% |
| 2022 | 17 351 | 26.8% | 26 227 | 40.6% | 12 961 | 20.1% | 64 641 | 100% |
| 2021 | 19 893 | 25% | 30 092 | 37.8% | 17 778 | 22.3% | 79 611 | 100% |
| 2020 | 19 227 | 24.5% | 28 951 | 36.9% | 17 302 | 22% | 78 507 | 100% |
| 2019 | 16 760 | 28.8% | 25 069 | 43% | 10 732 | 18.4% | 58 266 | 100% |
| 2018 | 18 181 | 28.6% | 27 409 | 43% | 11 079 | 17.4% | 63 678 | 100% |
| 2017 | 23 712 | 27.9% | 35 923 | 42.2% | 14 473 | 17% | 85 033 | 100% |
| 2016 | 28 632 | 26% | 42 904 | 38.9% | 20 186 | 18.3% | 110 235 | 100% |
| 2015 | 31 636 | 24.7% | 47 210 | 36.8% | 24 263 | 18.9% | 128 117 | 100% |
| 2014 | 34 463 | 24.6% | 51 124 | 36.4% | 26 863 | 19.1% | 140 330 | 100% |
40 to 54 years
| 40 to 54 years – May | NRO12 | | NRO20 | | VRO | | Slovakia | |
|---|
| 2026 | 16 217 | 27% | 23 356 | 38.9% | 12 694 | 21.2% | 59 985 | 100% |
| 2025 | 16 011 | 27.6% | 23 314 | 40.2% | 11 578 | 19.9% | 58 057 | 100% |
| 2024 | 16 731 | 28.6% | 24 390 | 41.7% | 11 152 | 19% | 58 553 | 100% |
| 2023 | 16 988 | 28.1% | 25 117 | 41.6% | 11 286 | 18.7% | 60 353 | 100% |
| 2022 | 17 579 | 26.8% | 26 566 | 40.5% | 12 691 | 19.3% | 65 588 | 100% |
| 2021 | 19 894 | 25% | 30 110 | 37.9% | 16 749 | 21.1% | 79 501 | 100% |
| 2020 | 18 635 | 25.3% | 27 752 | 37.6% | 14 962 | 20.3% | 73 762 | 100% |
| 2019 | 16 882 | 30% | 24 960 | 44.3% | 9071 | 16.1% | 56 330 | 100% |
| 2018 | 18 574 | 29.5% | 27 767 | 44.2% | 9390 | 14.9% | 62 887 | 100% |
| 2017 | 22 958 | 28.3% | 34 396 | 42.4% | 12 291 | 15.2% | 81 121 | 100% |
| 2016 | 26 618 | 25.8% | 39 602 | 38.5% | 17 354 | 16.9% | 102 973 | 100% |
| 2015 | 28 896 | 24.5% | 42 925 | 36.4% | 20 797 | 17.7% | 117 804 | 100% |
| 2014 | 30 915 | 24.2% | 45 696 | 35.7% | 23 203 | 18.1% | 127 879 | 100% |
55 years and more
| 55 years and more – May | NRO12 | | NRO20 | | VRO | | Slovakia | |
|---|
| 2026 | 7749 | 25.7% | 11 220 | 37.2% | 5736 | 19% | 30 181 | 100% |
| 2025 | 7660 | 27.6% | 11 096 | 39.9% | 4747 | 17.1% | 27 797 | 100% |
| 2024 | 8028 | 27.2% | 11 830 | 40% | 5085 | 17.2% | 29 555 | 100% |
| 2023 | 8331 | 25.7% | 12 444 | 38.4% | 5930 | 18.3% | 32 368 | 100% |
| 2022 | 8885 | 24.7% | 13 412 | 37.3% | 6938 | 19.3% | 36 002 | 100% |
| 2021 | 10 192 | 23% | 15 491 | 34.9% | 9343 | 21.1% | 44 329 | 100% |
| 2020 | 8842 | 23.7% | 13 144 | 35.2% | 7415 | 19.9% | 37 343 | 100% |
| 2019 | 8037 | 26.9% | 11 840 | 39.6% | 5153 | 17.3% | 29 865 | 100% |
| 2018 | 8525 | 26.5% | 12 651 | 39.3% | 5492 | 17% | 32 219 | 100% |
| 2017 | 9508 | 24.6% | 14 174 | 36.6% | 7045 | 18.2% | 38 703 | 100% |
| 2016 | 9936 | 22% | 14 762 | 32.7% | 9268 | 20.5% | 45 190 | 100% |
| 2015 | 10 340 | 20.7% | 15 437 | 30.9% | 10 823 | 21.6% | 50 001 | 100% |
| 2014 | 10 432 | 20.5% | 15 498 | 30.5% | 11 223 | 22.1% | 50 895 | 100% |
Notes:
Suggested citation: Michal Páleník: Regions of Slovakia - Detailed statistics of least developed regions in Slovakia, IZ Bratislava, retrieved from: https://www.iz.sk/en/project/least-developed-region/detailed-statistics
https://www.iz.sk/en/project/least-developed-region/detailed-statistics
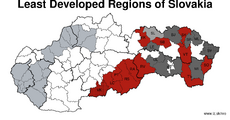
Least developed regions in Slovakia.. . .

On our webpage, we have several data which are regularly updated. These include data on unemployment or legislation.. . .
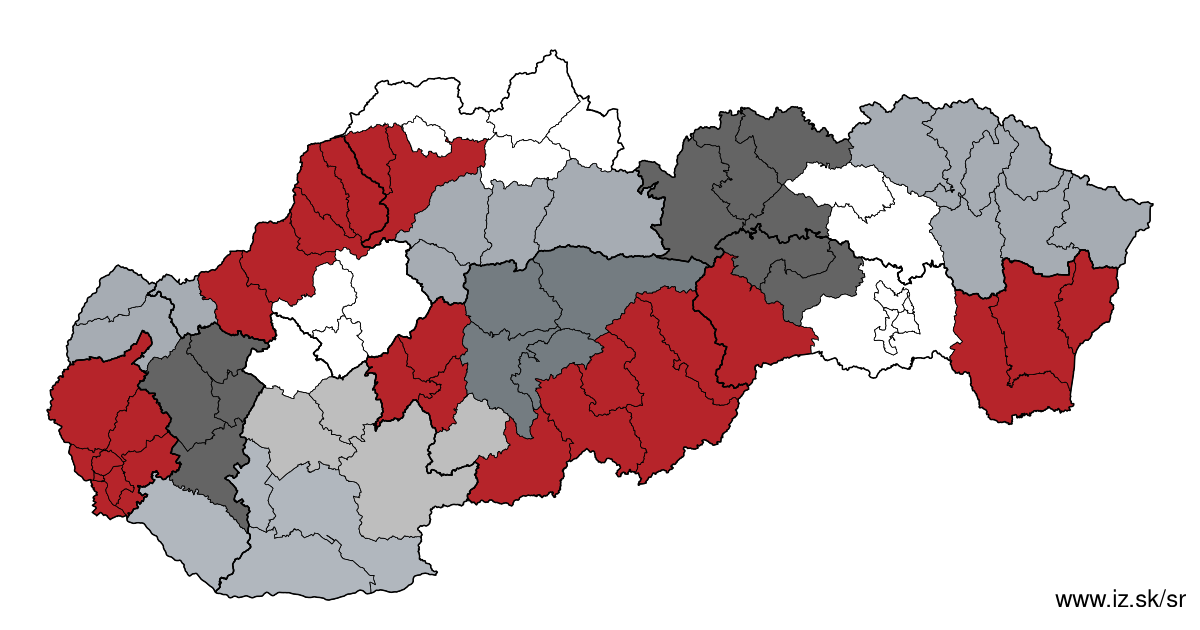
Due to the need of analysis we have created regions of Slovakia. We will bring more information about these regions from the macroeconomic point of view as well as from the point of view of the labour market.. . .

 Share
Share Facebook
 Twitter
 News
News