Region upper Zemplín
consists of counties:
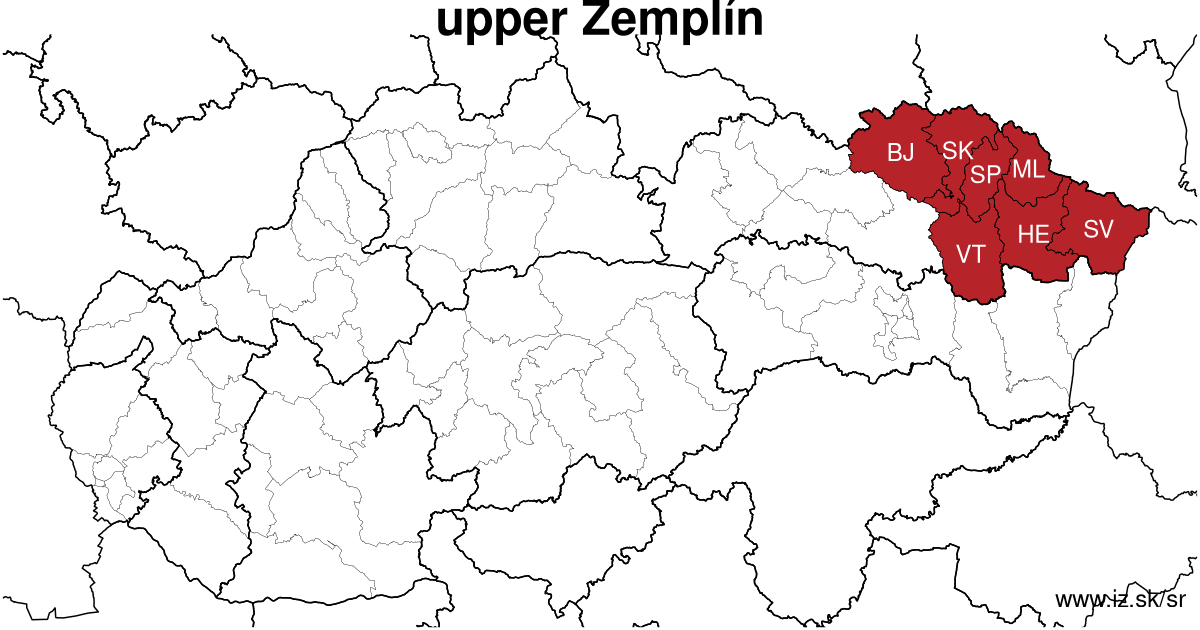
Towns
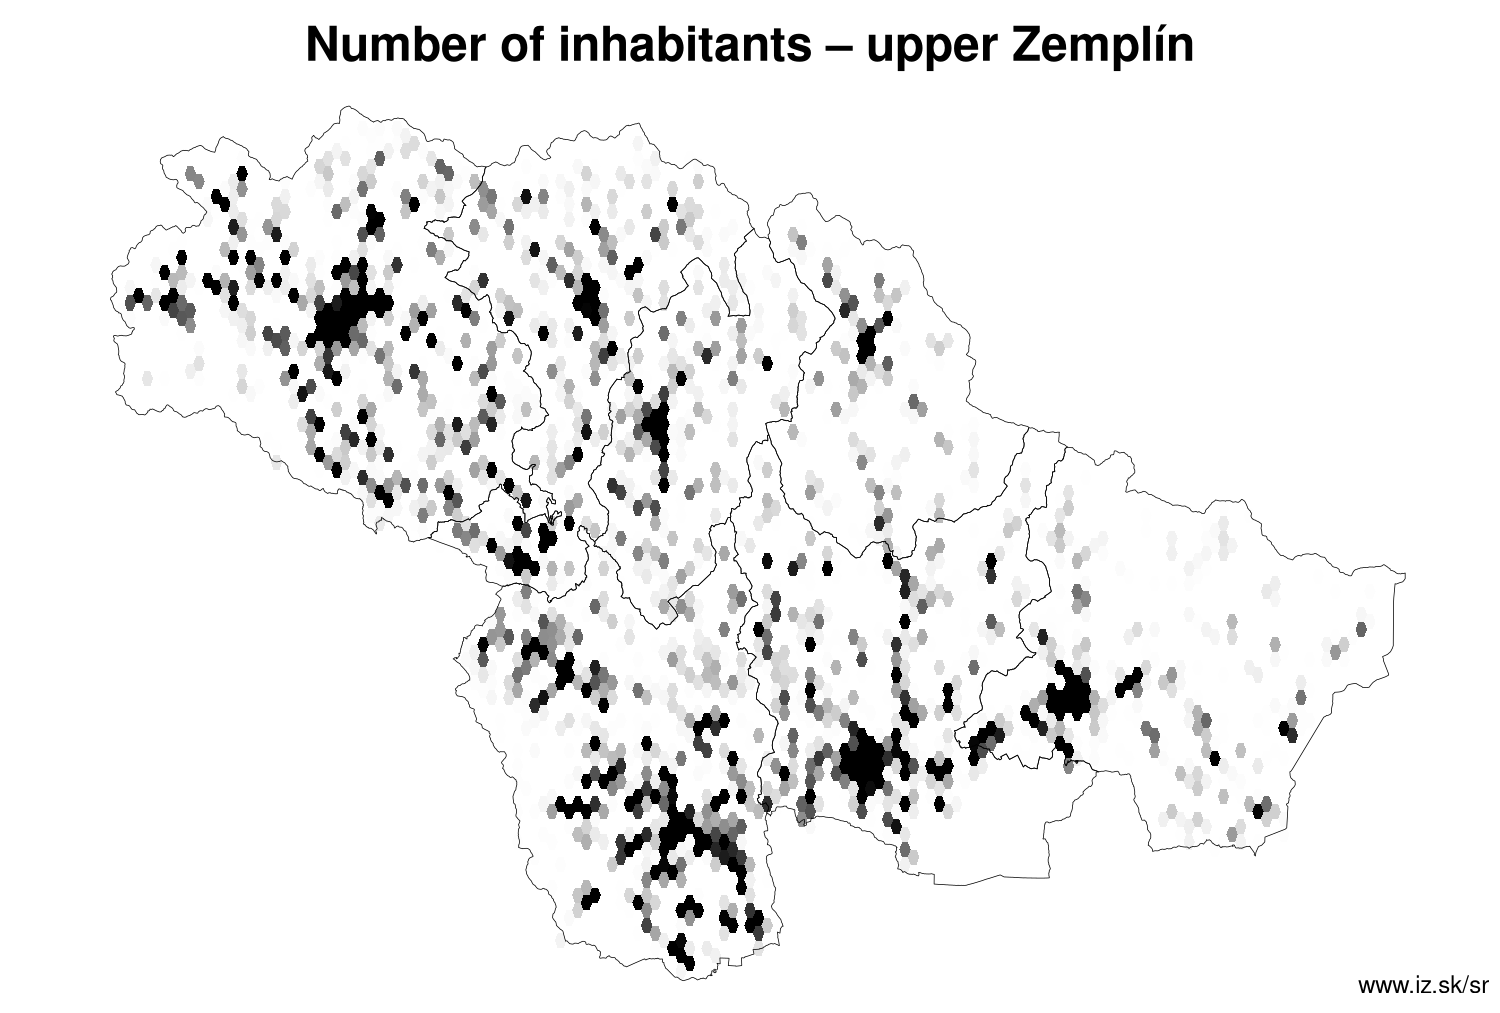
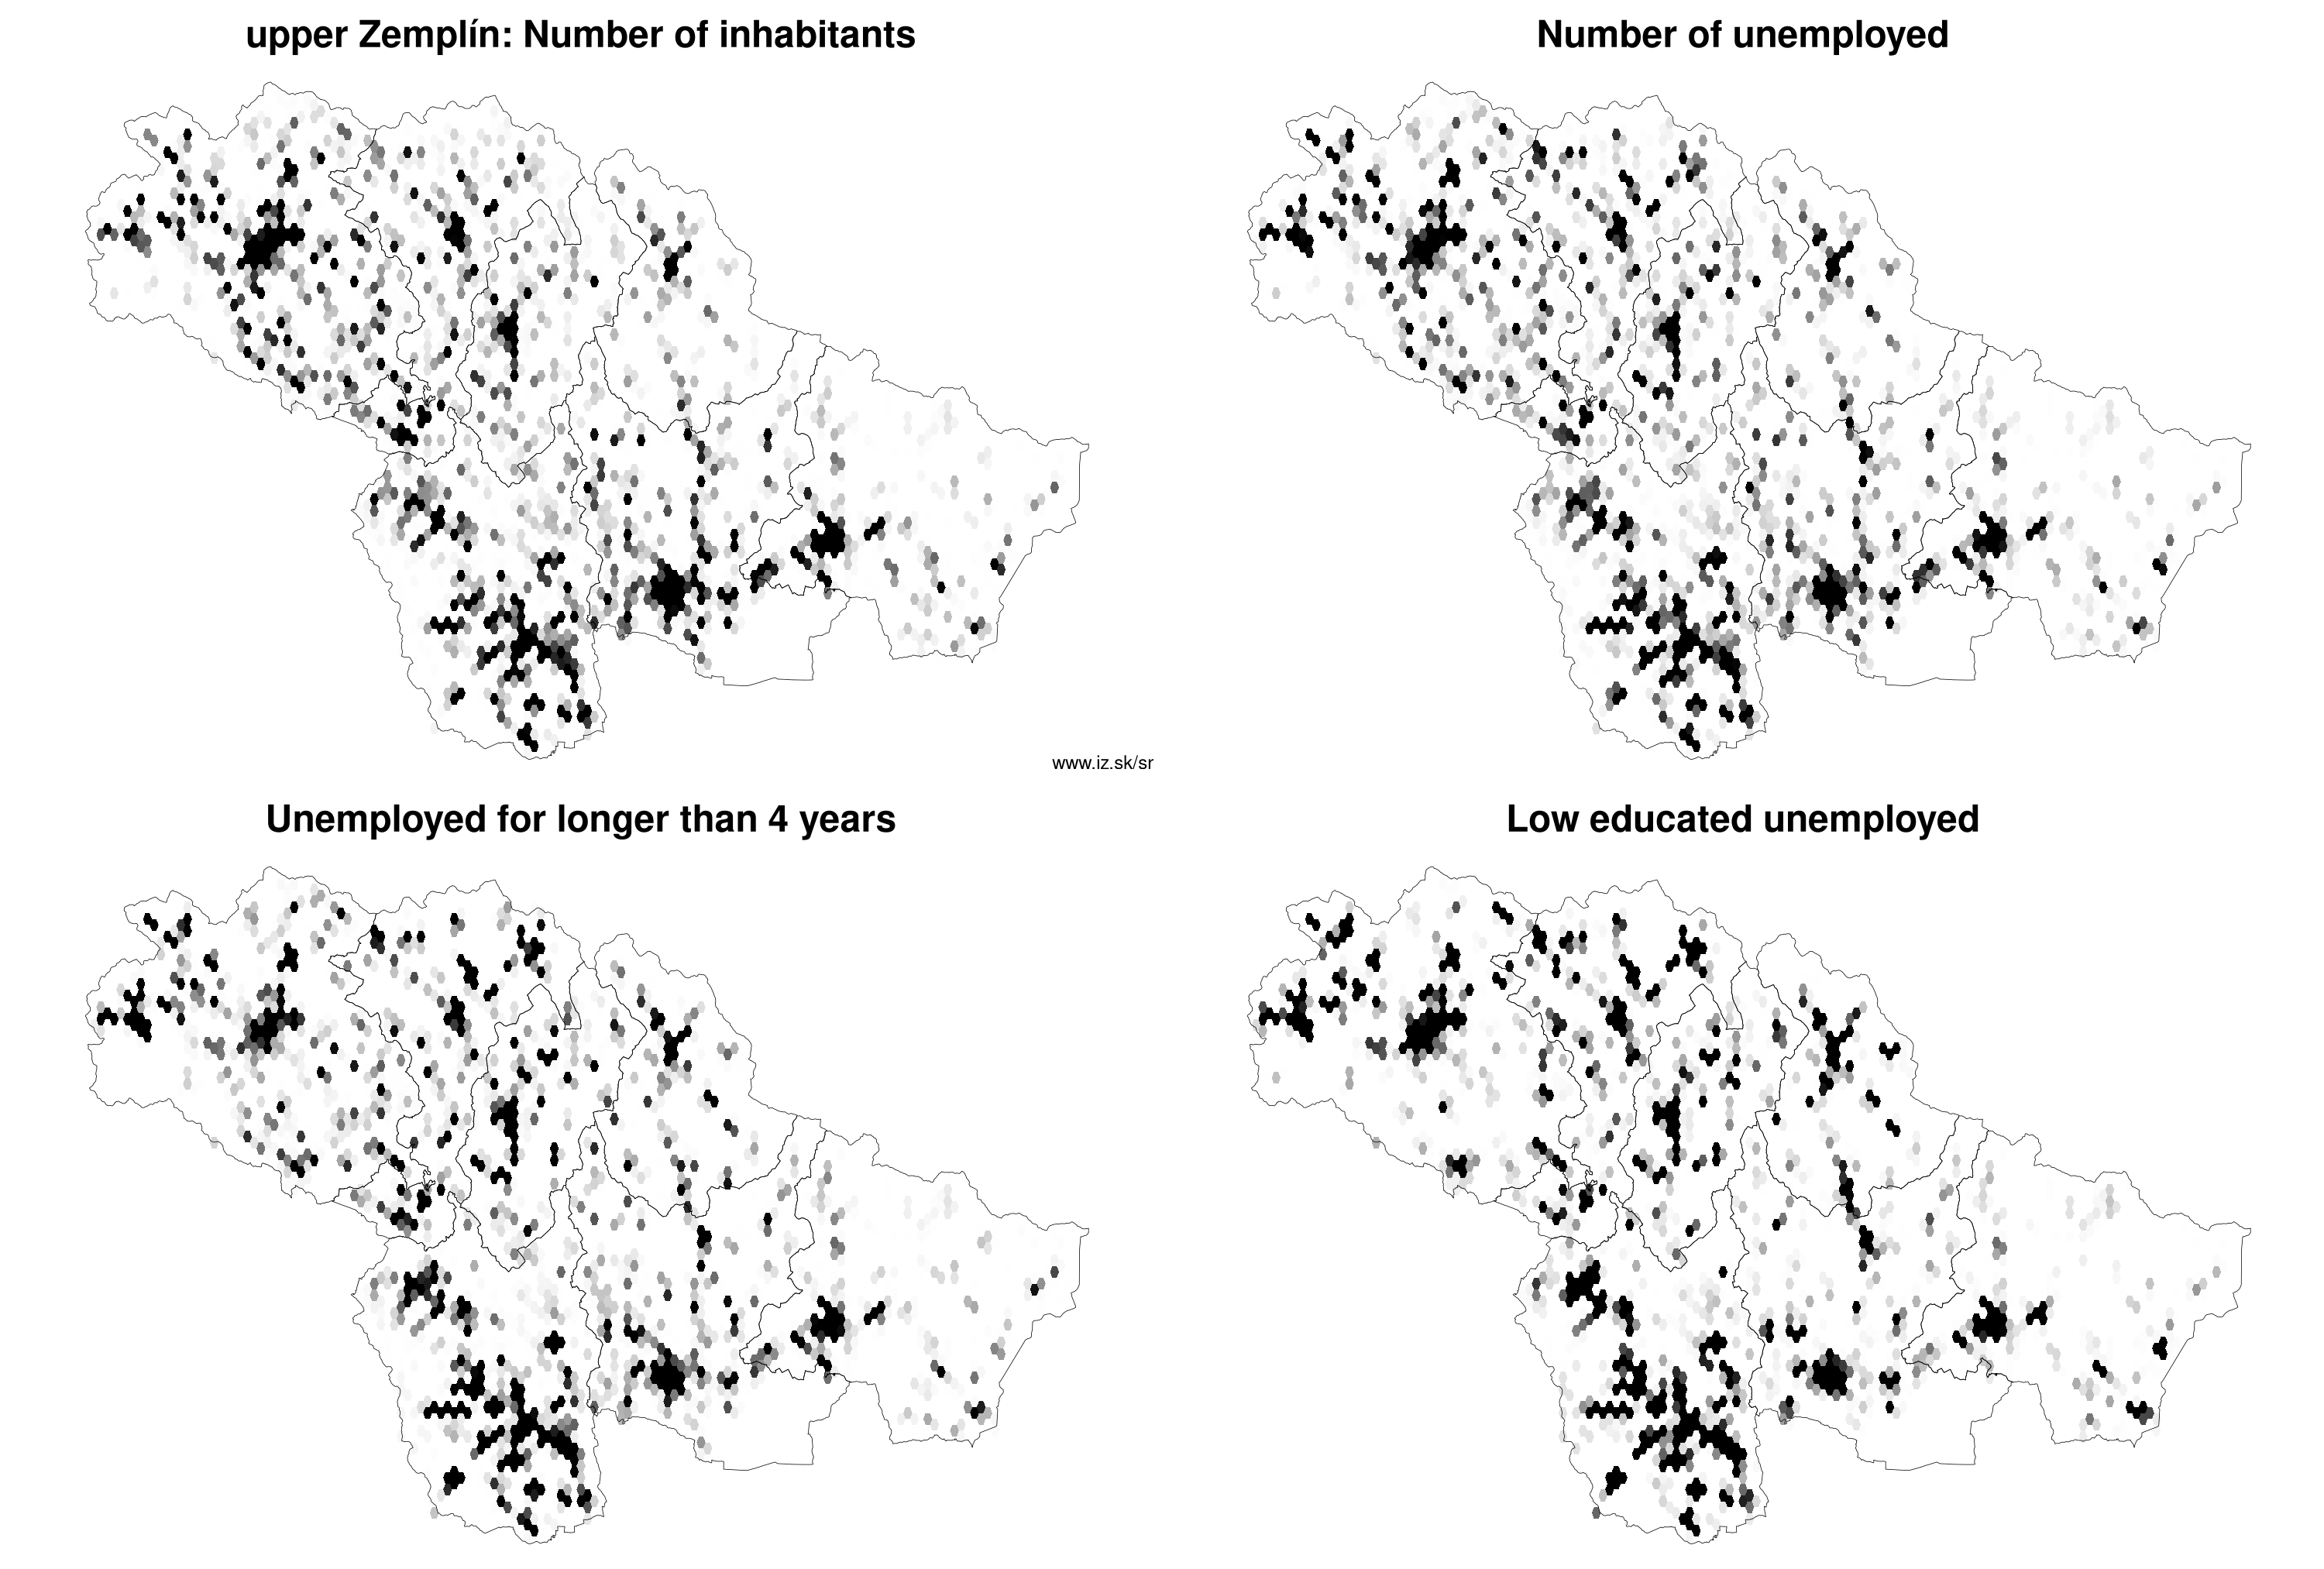
Region upper Zemplín contains cities Bardejov, Giraltovce, Hanušovce nad Topľou, Humenné, Medzilaborce, Snina, Stropkov, Svidník, Vranov nad Topľou and 375 villages. Statistics on city level on unemployment are for the period of 2026-06-01, for population are fore yar 2025.
name | number of inhabitants in economically active age | number of unemployed number of unemployed women number of long-term unemployed | unemployment rate unemployment rate of women long-term unemployment rate |
|---|---|---|---|
 Bardejov | 29 495 19 388 | 1 091 554 440 | 5.6 % 5.9 % 2.3 % |
 Humenné | 29 179 19 367 | 1 059 574 434 | 5.5 % 5.9 % 2.2 % |
 Vranov nad Topľou | 20 007 13 388 | 989 525 480 | 7.4 % 7.9 % 3.6 % |
 Snina | 17 612 11 980 | 722 433 339 | 6 % 7.2 % 2.8 % |
 Stropkov | 9 660 6 386 | 560 295 308 | 8.8 % 9.5 % 4.8 % |
 Svidník | 9 500 6 080 | 420 214 173 | 6.9 % 7 % 2.8 % |
 Medzilaborce | 5 669 3 700 | 415 208 216 | 11.2 % 11.5 % 5.8 % |
 Giraltovce | 3 920 2 667 | 245 141 130 | 9.2 % 10.8 % 4.9 % |
 Hanušovce nad Topľou | 3 719 2 405 | 295 173 173 | 12.3 % 14.3 % 7.2 % |
Villages with over 2000 inhabitants are Zborov (3670), Zámutov (3405), Belá nad Cirochou (3279), Vechec (3025), Raslavice (2802), Čaklov (2774), Bystré (2766), Soľ (2664), Sečovská Polianka (2619), Sačurov (2610), Stakčín (2351), Kamenica nad Cirochou (2305), Banské (2018).
| villages by number of inhabitants | ||||||
|---|---|---|---|---|---|---|
| total | up to 300 | 300 to 500 | 500 to 1000 | 1000 to 1500 | over 1500 | |
| 375 | 184 | 73 | 78 | 20 | 20 | |
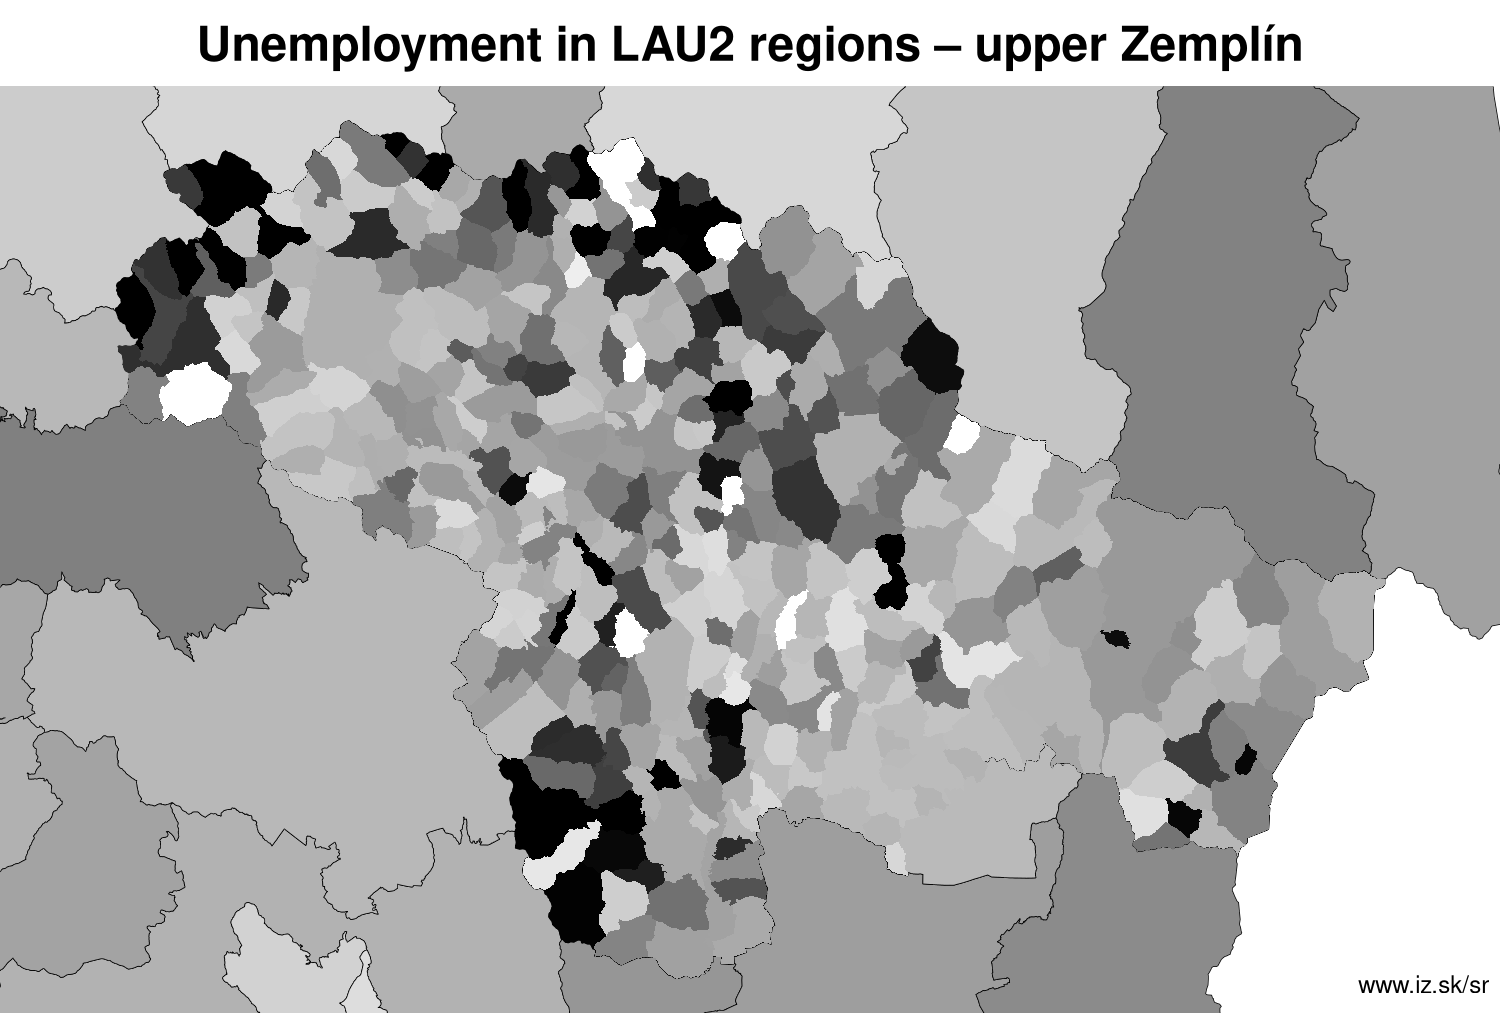
Unemployment
| rok | 2012 | 2014 | 2016 | 2018 | 2019 | 2020 | 2021 | 2022 | 2023 | 2024 | 2025 | 2026 |
|---|---|---|---|---|---|---|---|---|---|---|---|---|
| number of unemployed | 36 531 | 35 400 | 30 856 | 19 966 | 18 813 | 21 080 | 21 909 | 19 460 | 18 575 | 17 647 | 17 218 | 17 657 |
| number of long-term unemployed | 19 735 | 21 701 | 17 531 | 9622 | 8250 | 8928 | 11 056 | 10 167 | 9428 | 9135 | 8612 | 8660 |
| number of people receiving social benefits | 35 946 | 34 012 | 24 556 | 18 178 | 16 524 | 16 025 | 14 250 | 14 954 | 14 681 | 14 256 | 13 522 | 14 070 |
| number of activational workers | 7275 | 7561 | 5314 | 3276 | 2991 | 2756 | 2646 | 2741 | 869 | 1751 | 1886 | 306 |
| unemployment rate | 15.7 | 15.4 | 13.6 | 8.9 | 8.5 | 9.6 | 10.4 | 9.4 | 9 | 8.7 | 8.5 | 8.7 |
| long-term unemployment rate | 8.5 | 9.4 | 7.7 | 4.3 | 3.7 | 4.1 | 5.3 | 4.9 | 4.6 | 4.5 | 4.3 | 4.3 |
| vacancies | 344 | 648 | 1826 | 2359 | 2867 | 2146 | 1900 | 1789 | 1162 | 1322 | 1172 | 1177 |
Demographics
| 2012 | 2014 | 2016 | 2018 | 2019 | 2020 | 2021 | 2022 | 2023 | 2024 | 2025 | 2026 | |
|---|---|---|---|---|---|---|---|---|---|---|---|---|
| number of inhabitants | 326 202 | 325 396 | 323 637 | 322 187 | 321 215 | 320 211 | 311 168 | 309 929 | 309 002 | 308 168 | 306 832 | 306 832 |
| assignation tax | 73 990 675 | 75 592 119 | 90 359 753 | 107 879 884 | 121 616 154 | 124 795 150 | 119 600 239 | 132 492 079 | 146 027 086 | 146 443 546 | 118 279 335 | 127 713 181 |
| demographic dependency | 18.7 | 19.9 | 21.5 | 23.2 | 24.3 | 25.2 | 26 | 27.1 | 28.3 | 29.4 | 30.5 | |
| number of employed foreigners | 107 | 769 | 880 | 648 | 770 | 826 | 823 | 982 | 1050 | 1254 | 1419 | 1585 |
Number of unemployed
| rok | 2012 | 2014 | 2016 | 2018 | 2019 | 2020 | 2021 | 2022 | 2023 | 2024 | 2025 | 2026 |
|---|---|---|---|---|---|---|---|---|---|---|---|---|
| less than 24 years | 9256 | 6818 | 5364 | 3074 | 2986 | 3323 | 3339 | 2901 | 2693 | 2563 | 2524 | 2530 |
| 25 to 39 years | 16 191 | 13 236 | 11 487 | 7128 | 6650 | 7417 | 7561 | 6704 | 6308 | 6009 | 5817 | 5891 |
| 40 to 54 years | 13 742 | 11 543 | 10 223 | 6683 | 6200 | 6929 | 7235 | 6547 | 6356 | 6066 | 5980 | 6279 |
| 55 years and more | 3870 | 3803 | 3782 | 3080 | 2977 | 3411 | 3774 | 3308 | 3218 | 3008 | 2898 | 3042 |
Other regions
- Basic data on Slovak regions
- Labour market indicators of slovak regions.
- Region Bratislava and surroundings
- Region Kopanice
- Region Danube river
- Region lower Vah river
- Region middle Vár river
- Region upper Nitra river
- Region lower Nitra river
- Region Mining cities
- Region Kysuce a Orava
- Region upper Vah river – Liptov
- Region Spiš cities
- Region upper Hron river
- Region Juhoslovenská kotlina
- Region Košice fold and Torysa river
- Region upper Zemplín
- Region lower Zemplín
Suggested citation: Michal Páleník: Regions of Slovakia - Region upper Zemplín, IZ Bratislava, retrieved from: https://www.iz.sk/en/projects/regions-of-slovakia/upper-zemplin
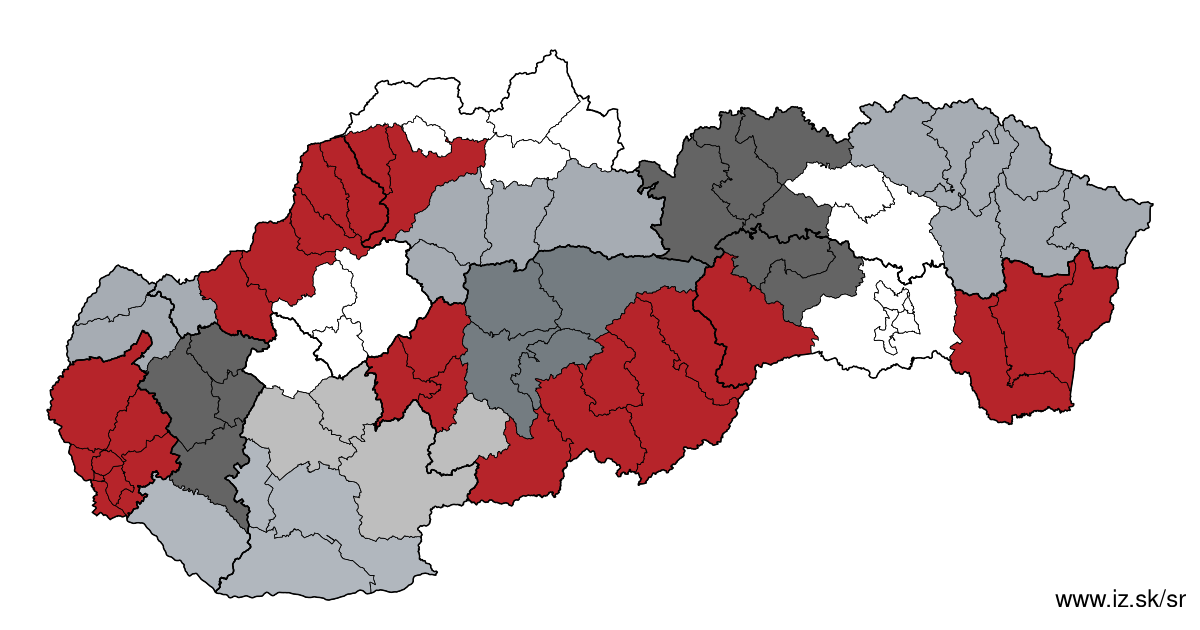
Regions of the Slovak Republic
Due to the need of analysis we have created regions of Slovakia. We will bring more information about these regions from the macroeconomic point of view as well as from the point of view of the labour market.. . .
 Share
Share Facebook
 Twitter
 News
News