- About us»
- Net income calculator»
- Population aging»
-
- Least developed regions»
-
- Average wage
- Material need benefits
- Meal allowance
- Counties of Slovakia
- Inflation
- Living and Subsistence Minimum
- Unemployment of Czechia and Slovakia
- NACE Classification
-
- Life expectancy
- Gender differences
- Youth unemployment and NEET
- Minimum wage in EU
- Unemployment rates of different age groups
- Share of salaries on GDP
- Percentage of employees ususally working at nights
- Unemployment rate
- Employment rate
- NEET
- Long term unemployment
-
- Bratislava and surroundings
- Kopanice
- Danube river
- lower Vah river
- middle Vár river
- upper Nitra river
- lower Nitra river
- Mining cities
- Kysuce a Orava
- upper Vah river - Liptov
- Spiš cities
- upper Hron river
- Juhoslovenská kotlina
- Košice fold and Torysa river
- upper Zemplín
- lower Zemplín
- EU regions
- NUTS3 regions of Slovakia
- LAU1 dataset
-
- Projects and activities
- Inclusive growth»
- Good work
- Project SKRS
- Social system – reality and vision
- Library
-
- Education of unemployed
- Young unemployed not taking part in education
- Proposal to change the system of education funding
- News»
- Contact
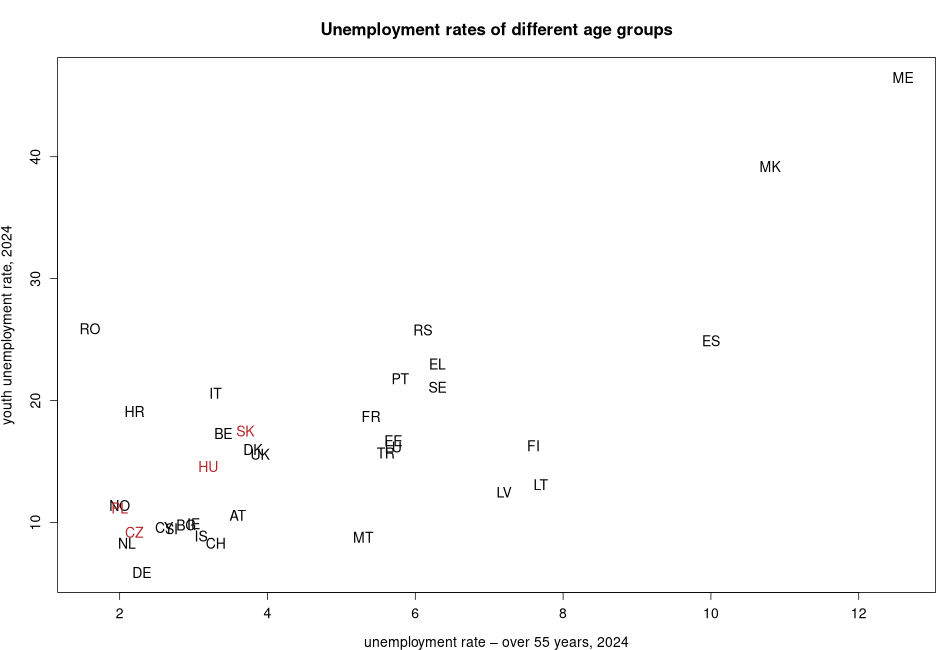
Unemployment rates of different age groups

| code | youth unemployment rate, 2025 | unemployment rate – over 55 years, 2025 | unemployment rate, 2025 | |
|---|---|---|---|---|
| AT | Austria | 11.6 | 3.5 | 5.5 |
| BE | Belgium | 19.8 | 3.9 | 6.5 |
| BG | Bulgaria | 14.8 | 2.5 | 3.5 |
| CH | Switzerland | 10.5 | 3.3 | 5.3 |
| CY | Cyprus | 13.1 | 2.4 | 4.2 |
| CZ | Czech Republic | 11.6 | 2.5 | 3 |
| DE | Germany | 8.3 | 2.8 | 4 |
| DK | Denmark | 14.2 | 3.6 | 6.6 |
| EE | Estonia | 20.1 | 4.8 | 7.4 |
| EL | Greece | 18.3 | 6.3 | 8.2 |
| ES | Spain | 25.4 | 10 | 10.6 |
| FI | Finland | 16.7 | 8.5 | 9.4 |
| FR | France | 21 | 5 | 7.9 |
| HR | Croatia | 18.8 | 2.3 | 4.2 |
| HU | Hungary | 14.8 | 3.2 | 4.6 |
| IE | Ireland | 14.1 | 3.7 | 5.4 |
| IS | Iceland | 8.3 | 3.1 | 3.7 |
| IT | Italy | 19 | 3.2 | 5.8 |
| LT | Lithuania | 12.5 | 8.4 | 6.9 |
| LU | Luxembourg | 20 | 5.7 | 6.2 |
| LV | Latvia | 12.1 | 6 | 7.3 |
| ME | Montenegro | 46.5 | 12.6 | 21.5 |
| MK | North Macedonia | 32.4 | 8.4 | 11.7 |
| MT | Malta | 9.6 | 5.3 | 2.8 |
| NL | Netherlands | 9.1 | 2.4 | 4 |
| NO | Norway | 14.5 | 1.4 | 4.8 |
| PL | Poland | 12.5 | 2.1 | 3.2 |
| PT | Portugal | 18.8 | 4.8 | 5.9 |
| RO | Romania | 27.3 | 3.8 | 6 |
| RS | Serbia | 23.4 | 5.6 | 8.5 |
| SE | Sweden | 20.3 | 5.9 | 8.4 |
| SI | Slovenia | 14 | 3.2 | 4.2 |
| SK | Slovakia | 16.6 | 4.3 | 5.6 |
| TR | Turkey | 16.3 | 5.3 | 8.7 |
| UK | United Kingdom | 15.6 | 3.9 | 5 |
More on the compared variables:
- youth unemployment rate, 2025
- unemployment rate – over 55 years, 2025
- unemployment rate, 2025
Suggested citation: Michal Páleník: Europe and its regions in numbers - Unemployment rates of different age groups, IZ Bratislava, retrieved from: https://www.iz.sk/en/projects/EU-indicators/unemployment-in-age-groups, ISBN: 978-80-970204-9-1, DOI:10.5281/zenodo.10200164
https://www.iz.sk/en/projects/EU-indicators/unemployment-in-age-groups

Education and labour market
Slovakia suffers from weak connections between education and labour market, which results in high unemployment of graduates and young people.. . .

 Share
Share Facebook
 Twitter
 News
News