Basic indicators
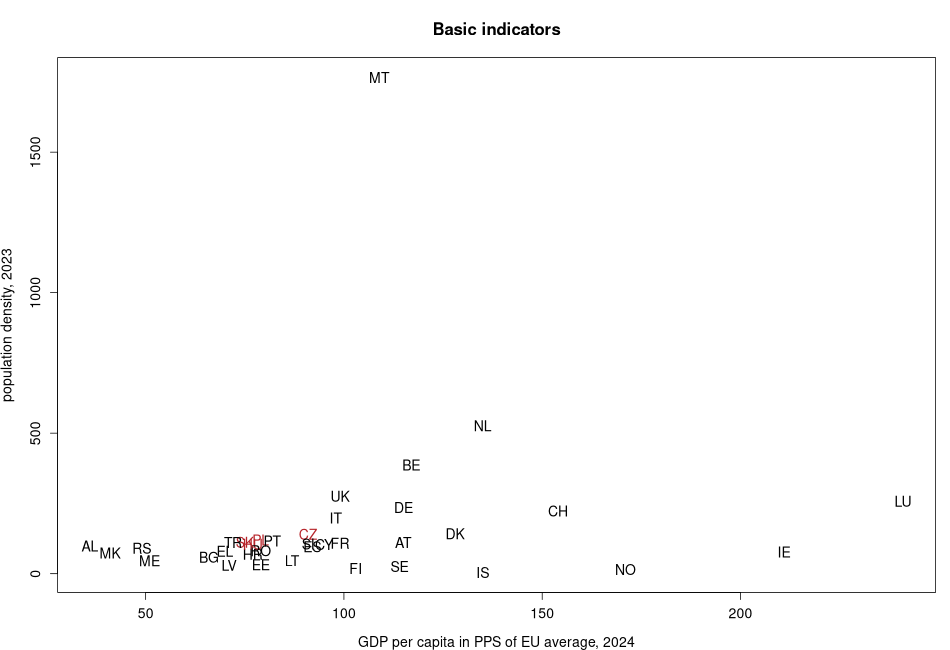
| code | population density, 2024 | GDP per capita in PPS of EU average, 2025 | number of inhabitants, 2025 | |
|---|---|---|---|---|
| AL | Albania | 84.6 | 43 | 2 363 314 |
| AT | Austria | 111.3 | 118 | 9 197 213 |
| BE | Belgium | 389.1 | 114 | 11 883 495 |
| BG | Bulgaria | 58.6 | 68 | 6 437 360 |
| CH | Switzerland | 226 | 157 | 9 051 029 |
| CY | Cyprus | 105.8 | 98 | 982 966 |
| CZ | Czech Republic | 141.2 | 92 | 10 909 500 |
| DE | Germany | 236.4 | 115 | 83 577 136 |
| DK | Denmark | 142.4 | 127 | 5 992 734 |
| EE | Estonia | 31.8 | 79 | 1 369 995 |
| EL | Greece | 79.8 | 68 | 10 372 335 |
| ES | Spain | 97.2 | 92 | 49 128 296 |
| FI | Finland | 18.5 | 101 | 5 635 971 |
| FR | France | 108.5 | 98 | 68 882 600 |
| HR | Croatia | 69.2 | 78 | 3 874 350 |
| HU | Hungary | 104.8 | 76 | 9 539 502 |
| IE | Ireland | 78.6 | 238 | 5 440 278 |
| IS | Iceland | 3.8 | 128 | 389 444 |
| IT | Italy | 198 | 96 | 58 943 464 |
| LI | Liechtenstein | 256 | 40 886 | |
| LT | Lithuania | 46.1 | 87 | 2 890 664 |
| LU | Luxembourg | 261.8 | 239 | 681 973 |
| LV | Latvia | 30 | 71 | 1 860 565 |
| ME | Montenegro | 45.8 | 54 | 623 327 |
| MK | North Macedonia | 73.3 | 43 | 1 822 612 |
| MT | Malta | 1817.4 | 110 | 574 250 |
| NL | Netherlands | 529.5 | 133 | 18 044 028 |
| NO | Norway | 15.3 | 159 | 5 594 340 |
| PL | Poland | 119 | 81 | 36 497 496 |
| PT | Portugal | 117.6 | 81 | 10 749 635 |
| RO | Romania | 81.3 | 78 | 19 043 152 |
| RS | Serbia | 90.5 | 52 | 6 567 783 |
| SE | Sweden | 26 | 111 | 10 587 710 |
| SI | Slovenia | 105.6 | 90 | 2 130 850 |
| SK | Slovakia | 111.3 | 75 | 5 419 451 |
| TR | Turkey | 111.6 | 67 | 85 664 944 |
| UK | United Kingdom | 275.3 | 99 | 66 647 112 |
More on the compared variables:
- population density, 2024
- GDP per capita in PPS of EU average, 2025
- number of inhabitants, 2025
Suggested citation: Michal Páleník: Europe and its regions in numbers - Basic indicators, IZ Bratislava, retrieved from: https://www.iz.sk/en/projects/EU-indicators/basic-indicators, ISBN: 978-80-970204-9-1, DOI:10.5281/zenodo.10200164
https://www.iz.sk/en/projects/EU-indicators/basic-indicators
Similar articles
Life expectancy, Vacancies and unemployment, GDP per capita in PPS of EU average – year 2025, Gender differences, Share of salaries on GDP – 1 quarter 2026, GDP per capita in PPS of EU average NUTS 1 – year 2024, HICP inflation – December 2025, Payable interest of public debt as % od GDP – year 2025, ALMP expenditures vs. unemployment
 Share
Share Facebook
 Twitter
 News
News