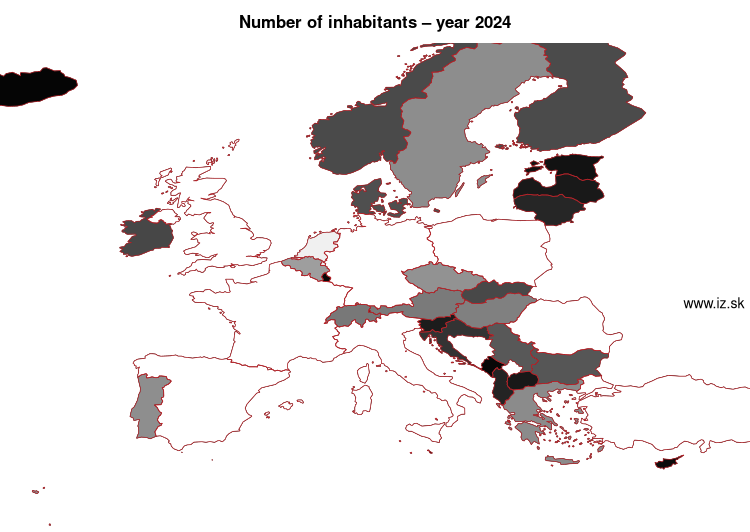
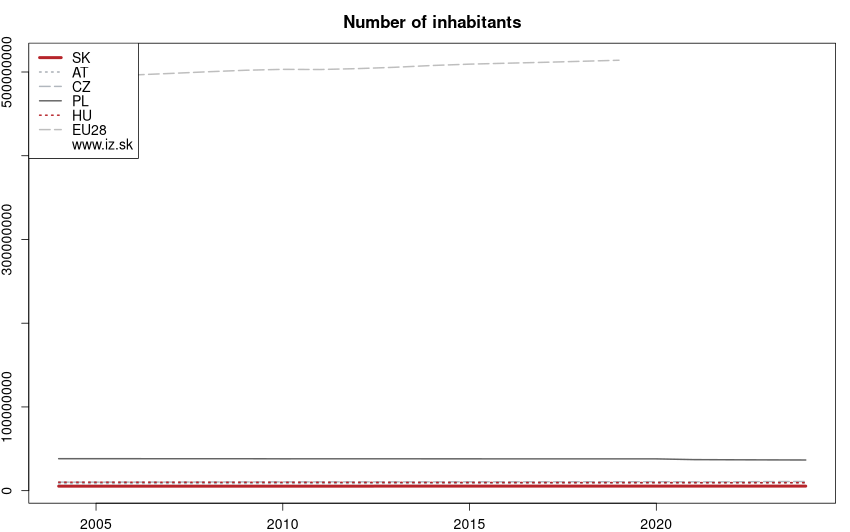
Number of inhabitants – year 2025
| Order | Code | Region | Value | Note |
|---|---|---|---|---|
| 1. | Liechtenstein | LI | 40 886 | |
| 2. | Iceland | IS | 389 444 | |
| 3. | Malta | MT | 574 250 | |
| 4. | Montenegro | ME | 623 327 | |
| 5. | Luxembourg | LU | 681 973 | |
| 6. | Cyprus | CY | 982 966 | |
| 7. | Estonia | EE | 1 369 995 | |
| 8. | North Macedonia | MK | 1 822 612 | |
| 9. | Latvia | LV | 1 860 565 | |
| 10. | Slovenia | SI | 2 130 850 | |
| 11. | Albania | AL | 2 363 314 | |
| 12. | Lithuania | LT | 2 890 664 | |
| 13. | Croatia | HR | 3 874 350 | |
| 14. | Slovakia | SK | 5 419 451 | |
| 15. | Ireland | IE | 5 440 278 | |
| 16. | Norway | NO | 5 594 340 | |
| 17. | Finland | FI | 5 635 971 | |
| 18. | Denmark | DK | 5 992 734 | |
| 19. | Bulgaria | BG | 6 437 360 | |
| 20. | Serbia | RS | 6 567 783 | |
| 21. | Switzerland | CH | 9 051 029 | |
| 22. | Austria | AT | 9 197 213 | |
| 23. | Hungary | HU | 9 539 502 | |
| 24. | Greece | EL | 10 372 335 | |
| 25. | Sweden | SE | 10 587 710 | |
| 26. | Portugal | PT | 10 749 635 | |
| 27. | Czech Republic | CZ | 10 909 500 | |
| 28. | Belgium | BE | 11 883 495 | |
| 29. | Netherlands | NL | 18 044 028 | |
| 30. | Romania | RO | 19 043 152 | |
| 31. | Poland | PL | 36 497 496 | |
| 32. | Spain | ES | 49 128 296 | |
| 33. | Italy | IT | 58 943 464 | |
| 34. | United Kingdom | UK | 66 647 112 | period 2019 |
| 35. | France | FR | 68 882 600 | |
| 36. | Germany | DE | 83 577 136 | |
| 37. | Turkey | TR | 85 664 944 |
Data for the period year 2025. Source of the data is Eurostat, table [demo_r_d2jan].
See also:
Suggested citation: Michal Páleník: Europe and its regions in numbers - Number of inhabitants – year 2025, IZ Bratislava, retrieved from: https://www.iz.sk/en/projects/EU-indicators/number-of-inhabitants, ISBN: 978-80-970204-9-1, DOI:10.5281/zenodo.10200164
https://www.iz.sk/en/projects/EU-indicators/number-of-inhabitants
 Share
Share Facebook
 Twitter
 News
News