Gender differences
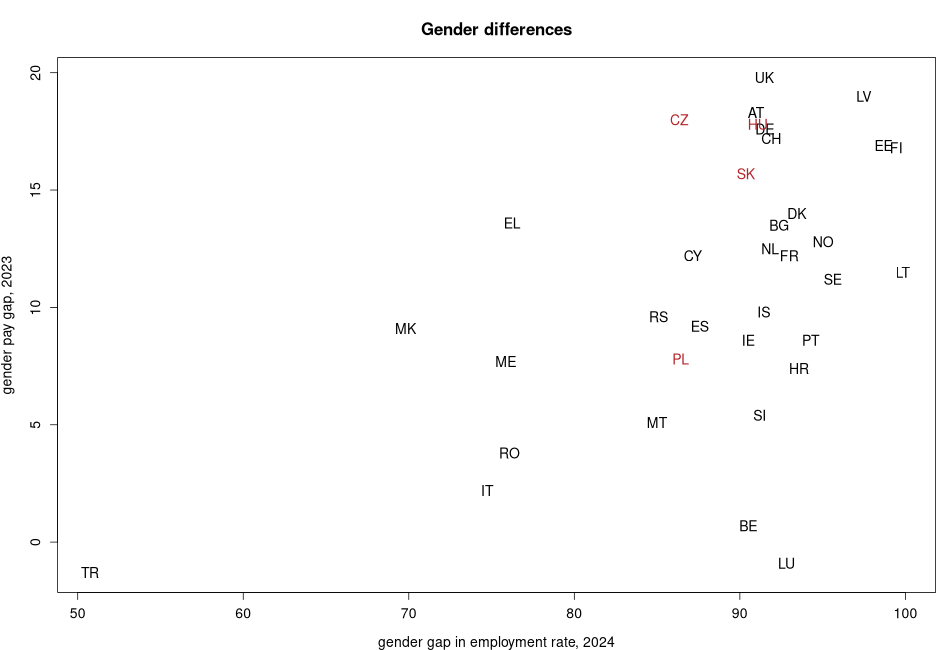
| code | gender pay gap, 2024 | gender gap in employment rate, 2026 | gender gap in unemployment rate, 2026 | |
|---|---|---|---|---|
| AL | Albania | 6.8 | ||
| AT | Austria | 17.6 | 92.32 | 86.96 |
| BE | Belgium | 0.7 | 92.53 | 93.85 |
| BG | Bulgaria | 12 | 91.84 | 91.18 |
| CH | Switzerland | 16 | 92.59 | 94.55 |
| CY | Cyprus | 11.8 | 90.47 | 97.56 |
| CZ | Czech Republic | 18.5 | 88.51 | 132.14 |
| DE | Germany | 15.6 | 92.14 | 84.09 |
| DK | Denmark | 14 | 93.65 | 111.27 |
| EE | Estonia | 18.8 | 100.13 | 107.04 |
| EL | Greece | 13.4 | 77.08 | 172.84 |
| ES | Spain | 7.3 | 87.73 | 130.21 |
| FI | Finland | 16.3 | 99.01 | 83.19 |
| FR | France | 11.8 | 93.97 | 89.66 |
| HR | Croatia | 6.6 | 91.89 | 96.49 |
| HU | Hungary | 16.9 | 90.2 | 97.92 |
| IE | Ireland | 8.3 | 89.65 | 108.33 |
| IS | Iceland | 11.1 | 94.65 | 120 |
| IT | Italy | 5.3 | 76.2 | 117.65 |
| LT | Lithuania | 10 | 100.41 | 77.01 |
| LU | Luxembourg | -0.8 | 91.09 | 116.42 |
| LV | Latvia | 13.9 | 99.72 | 98.65 |
| ME | Montenegro | 7.7 | 75.86 | 108.21 |
| MK | North Macedonia | 9.1 | 73.72 | 84.55 |
| MT | Malta | 4.9 | 87.22 | 89.19 |
| NL | Netherlands | 11.2 | 91.92 | 107.32 |
| NO | Norway | 13 | 94.62 | 86.79 |
| PL | Poland | 4 | 88.26 | 109.37 |
| PT | Portugal | 7 | 93.71 | 125 |
| RO | Romania | 3.7 | 75.92 | 98.48 |
| RS | Serbia | 9.6 | 86.22 | 95.74 |
| SE | Sweden | 11.2 | 96.36 | 93.68 |
| SI | Slovenia | 8 | 94.23 | 104.88 |
| SK | Slovakia | 15.7 | 89.2 | 108.62 |
| TR | Turkey | -1.3 | 49.37 | 155.41 |
| UK | United Kingdom | 19.8 | 91.48 | 83.33 |
More on the compared variables:
- gender pay gap, 2024
- gender gap in employment rate, 2026
- gender gap in unemployment rate, 2026
Suggested citation: Michal Páleník: Europe and its regions in numbers - Gender differences, IZ Bratislava, retrieved from: https://www.iz.sk/en/projects/EU-indicators/gender-differences, ISBN: 978-80-970204-9-1, DOI:10.5281/zenodo.10200164
https://www.iz.sk/en/projects/EU-indicators/gender-differences
Similar articles
Healthy life expectancy of men vs. women – year 2024, Gender gap in unemployment rate NUTS 1 – year 2024, Basic indicators, Gender gap in unemployment rate NUTS 2 – year 2025, Employment of mothers of more than 3 children – year 2025, Gender pay gap – year 2024, Gender gap in employment rate NUTS 2 – year 2025
 Share
Share Facebook
 Twitter
 News
News