Healthy life expectancy of men vs. women – year 2024
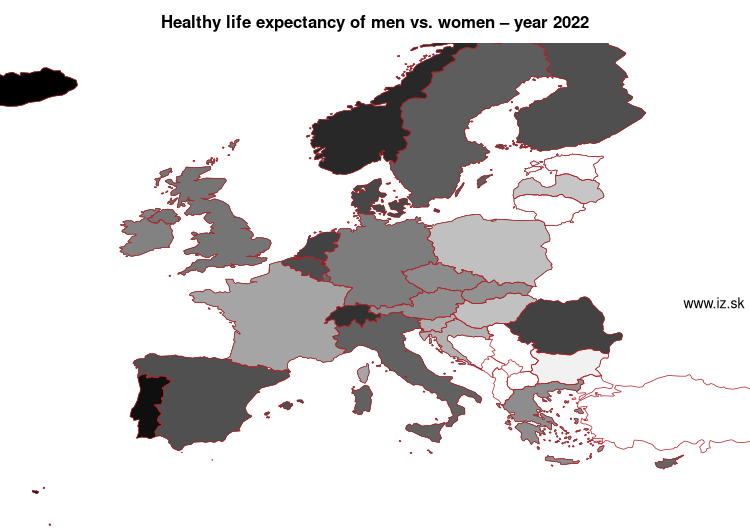
| Order | Code | Region | Value | Note |
|---|---|---|---|---|
| 1. | Iceland | IS | 87,82 | period 2018 |
| 2. | Portugal | PT | 94,06 | |
| 3. | Norway | NO | 94,92 | |
| 4. | Switzerland | CH | 95,5 | |
| 5. | Sweden | SE | 96,08 | |
| 6. | Malta | MT | 96,73 | |
| 7. | Netherlands | NL | 98,39 | |
| 8. | Belgium | BE | 100 | |
| 9. | Luxembourg | LU | 100,54 | period 2022 |
| 10. | Spain | ES | 101,31 | |
| 11. | Denmark | DK | 101,48 | |
| 12. | Cyprus | CY | 102,19 | |
| 13. | United Kingdom | UK | 102,56 | period 2018 |
| 14. | Ireland | IE | 103,11 | |
| 15. | Italy | IT | 103,16 | |
| 16. | Germany | DE | 103,43 | |
| 17. | Finland | FI | 103,93 | |
| 18. | Romania | RO | 105,23 | |
| 19. | Greece | EL | 105,56 | |
| 20. | Czech Republic | CZ | 105,92 | |
| 21. | France | FR | 106,12 | |
| 22. | Austria | AT | 106,4 | |
| 23. | Slovenia | SI | 107,14 | |
| 24. | Croatia | HR | 107,5 | |
| 25. | Hungary | HU | 108,93 | |
| 26. | Slovakia | SK | 109,68 | |
| 27. | Poland | PL | 110,27 | |
| 28. | Bulgaria | BG | 115,79 | |
| 29. | Lithuania | LT | 117,54 | |
| 30. | Estonia | EE | 118,12 | |
| 31. | Latvia | LV | 120,79 |
Data for the period year 2024. Source of the data is Eurostat, table [hlth_hlye].
See also:
Suggested citation: Michal Páleník: Europe and its regions in numbers - Healthy life expectancy of men vs. women – year 2024, IZ Bratislava, retrieved from: https://www.iz.sk/en/projects/EU-indicators/healthy-life-expectancy-men-women, ISBN: 978-80-970204-9-1, DOI:10.5281/zenodo.10200164
https://www.iz.sk/en/projects/EU-indicators/healthy-life-expectancy-men-women
Similar articles
Gender gap in unemployment rate NUTS 1 – year 2024, Gender gap in unemployment rate NUTS 2 – year 2025, Employment of mothers of more than 3 children – year 2025, Demographic changes in Slovakia, Gender pay gap – year 2024, Gender differences, Gender gap in employment rate NUTS 2 – year 2025
 Share
Share Facebook
 Twitter
 News
News