United Kingdom – UK
United Kingdom slovensky: UK
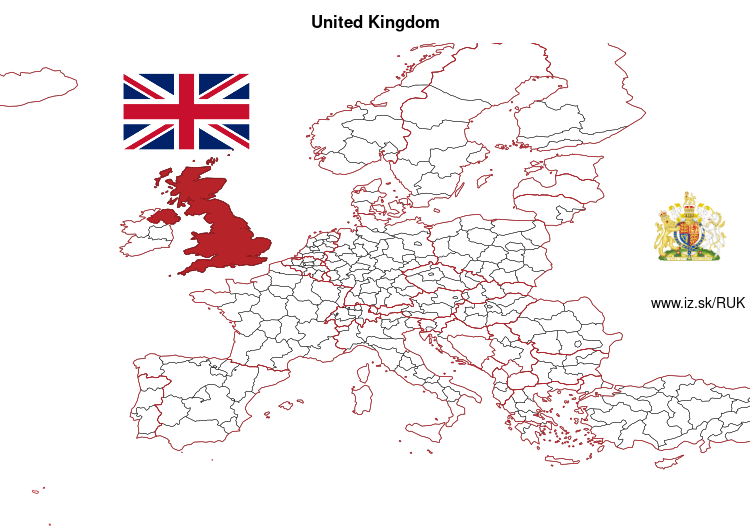
Subregions: North East England, North West England, Yorkshire and the Humber, East Midlands, West Midlands, East of England, Greater London, South East England, South West England, Wales, Scotland, Northern Ireland
Unemployment
| Indicator | Period | Value |
|---|---|---|
| Unemployment | ||
| unemployment rate | 2019 | 3.8 |
| youth unemployment rate | 2019 | 11.2 |
| Long term unemployment | ||
| long term unemployment | 2019 | 1 |
| share of long term unemployed | 2019 | 25.5 |
Demographics
| Indicator | Period | Value |
|---|---|---|
| Demographics | ||
| number of inhabitants | 2019 | 66 647 112 |
| population density | 2020 | 275.3 |
| old-age dependency ratio | 2019 | 28.9 |
| Population ageing | ||
| unemployment rate – over 55 years | 2020q3 | 3.9 |
| aggregate replacement ratio | 2018 | 0.61 |
| aggregate replacement ratio – females | 2018 | 0.64 |
| life expectancy of a 50 year old | 2018 | 33.1 |
| healty life expectancy at 50 years | 2018 | 19.7 |
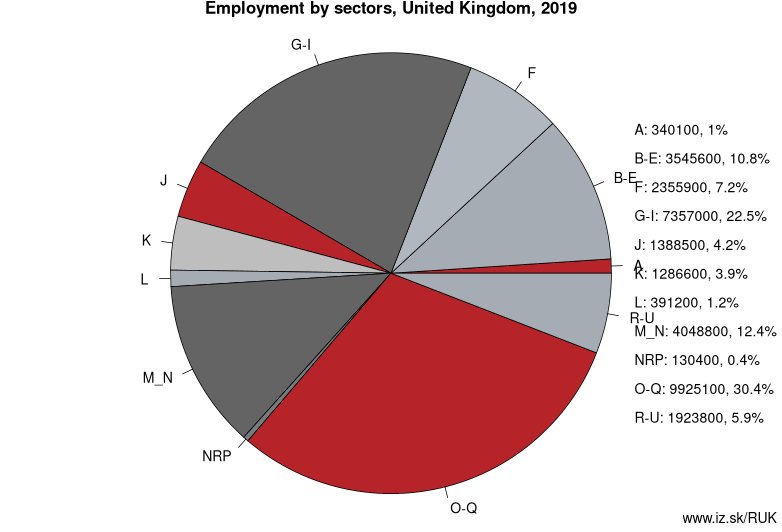
Employment by sectors, United Kingdom
| NACE r2 | % | NACE r2 | % | ||
|---|---|---|---|---|---|
| A | 340.1 | 1% | B-E | 3545.6 | 11% |
| F | 2355.9 | 7% | G-I | 7357 | 23% |
| J | 1388.5 | 4% | K | 1286.6 | 4% |
| L | 391.2 | 1% | M_N | 4048.8 | 12% |
| NRP | 130.4 | 0% | O-Q | 9925.1 | 30% |
| R-U | 1923.8 | 6% | TOTAL | 32 693 | 100% |
Data for the period year 2019. Source of the data is Eurostat, table [lfst_r_lfe2en2].
Other: United Kingdom
Neighbours: Ireland
Subregions: North East England, North West England, Yorkshire and the Humber, East Midlands, West Midlands, East of England, Greater London, South East England, South West England, Wales, Scotland, Northern Ireland
Suggested citation: Michal Páleník: Europe and its regions in numbers - United Kingdom – UK, IZ Bratislava, retrieved from: https://www.iz.sk/PUK, ISBN: 978-80-970204-9-1, DOI:10.5281/zenodo.10200164
 Share
Share Facebook
 Twitter
 News
News