- About us»
- Net income calculator»
- Population aging»
-
- Least developed regions»
-
- Average wage
- Material need benefits
- Meal allowance
- Counties of Slovakia
- Inflation
- Living and Subsistence Minimum
- Unemployment of Czechia and Slovakia
- NACE Classification
-
- Life expectancy
- Gender differences
- Youth unemployment and NEET
- Minimum wage in EU
- Unemployment rates of different age groups
- Share of salaries on GDP
- Employment rate
- Percentage of employees ususally working at nights
- Unemployment rate
- NEET
- Long term unemployment
-
- Bratislava and surroundings
- Kopanice
- Danube river
- lower Vah river
- middle Vár river
- upper Nitra river
- lower Nitra river
- Mining cities
- Kysuce a Orava
- upper Vah river - Liptov
- Spiš cities
- upper Hron river
- Juhoslovenská kotlina
- Košice fold and Torysa river
- upper Zemplín
- lower Zemplín
- EU regions
- NUTS3 regions of Slovakia
- LAU1 dataset
-
- Projects and activities
- Inclusive growth»
- Good work
- Project SKRS
- Social system – reality and vision
-
- Education of unemployed
- Young unemployed not taking part in education
- Proposal to change the system of education funding
- Library
- News»
- Contact
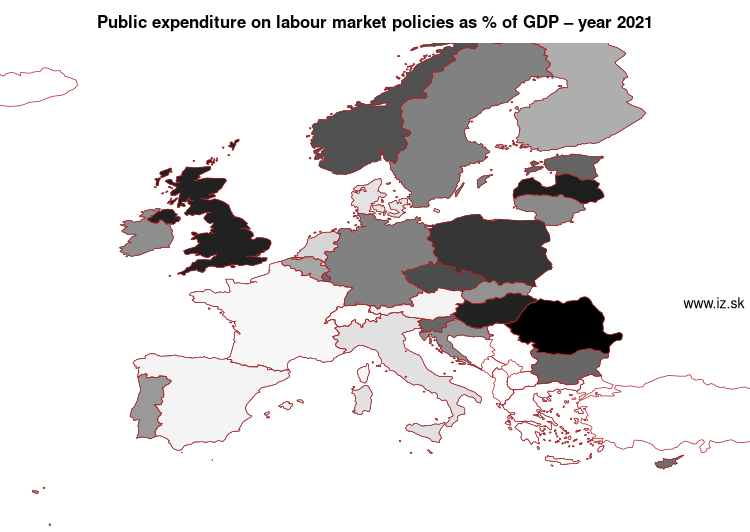
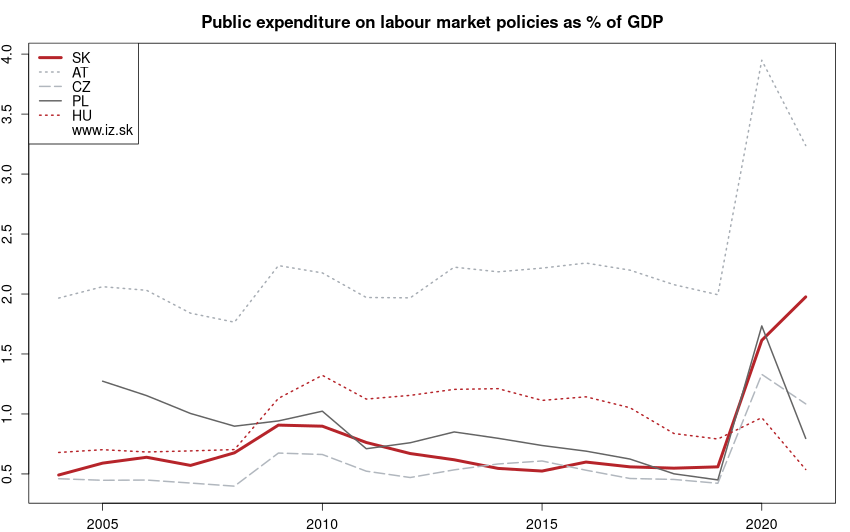
IZ Bratislava : Regularly updated : EU indicators : Public expenditure on labour market policies as % of GDP :
Public expenditure on labour market policies as % of GDP – year 2023

| Order | Code | Region | Value | Note |
|---|---|---|---|---|
| 1. | Romania | RO | 0,1 | period 2020 |
| 2. | Poland | PL | 0,36 | |
| 3. | Slovenia | SI | 0,36 | |
| 4. | Bulgaria | BG | 0,38 | |
| 5. | Cyprus | CY | 0,39 | |
| 6. | Czech Republic | CZ | 0,4 | |
| 7. | Hungary | HU | 0,42 | |
| 8. | Malta | MT | 0,43 | period 2024 |
| 9. | Latvia | LV | 0,52 | |
| 10. | United Kingdom | UK | 0,53 | period 2011 |
| 11. | Norway | NO | 0,58 | |
| 12. | Ireland | IE | 0,61 | |
| 13. | Slovakia | SK | 0,7 | period 2024 |
| 14. | Lithuania | LT | 0,86 | period 2024 |
| 15. | Greece | EL | 0,93 | |
| 16. | Portugal | PT | 1,1 | |
| 17. | Estonia | EE | 1,11 | period 2024 |
| 18. | Luxembourg | LU | 1,27 | period 2024 |
| 19. | Sweden | SE | 1,28 | |
| 20. | Netherlands | NL | 1,34 | |
| 21. | Germany | DE | 1,42 | period 2024 |
| 22. | Italy | IT | 1,56 | |
| 23. | Belgium | BE | 1,56 | |
| 24. | Croatia | HR | 1,93 | period 2021 |
| 25. | Finland | FI | 2 | |
| 26. | Austria | AT | 2,05 | period 2024 |
| 27. | Denmark | DK | 2,15 | period 2024 |
| 28. | Spain | ES | 2,38 | |
| 29. | France | FR | 2,49 |
Data for the period year 2023. Source of the data is Eurostat, table [lmp_expsumm].

See also:
Suggested citation: Michal Páleník: Europe and its regions in numbers - Public expenditure on labour market policies as % of GDP – year 2023, IZ Bratislava, retrieved from: https://www.iz.sk/en/projects/EU-indicators/public-expenditure-on-labour-market-policies-as-perc-of-gdp, ISBN: 978-80-970204-9-1, DOI:10.5281/zenodo.10200164
https://www.iz.sk/en/projects/EU-indicators/public-expenditure-on-labour-market-policies-as-perc-of-gdp

 Share
Share Facebook
 Twitter
 News
News