Education of unemployed
Regional offices of labour, social affairs and family in Slovakia de-iure organize education of unemployed. Unfortunatelly, the volume of people in the education is very low, approaching only several permille.
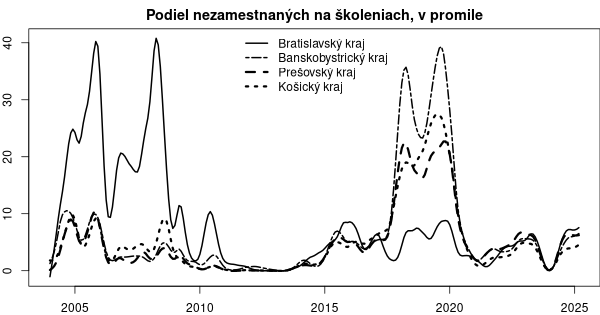
Development of the share of unemployed in education
As we can see, the shared of unemployed in education drastically decreased. There vere large seasonal changes between years 2004 and 2009. Most of the people attended education in October, November and December. The share varied between 0.01 % and 1.5 %. The last larger month was in March 2009, when the share of unemployed in education attacked 1.5 %. After this era of education campains, there was drastic decrease of eduction. Between May 2009 and March 2014, there were only 14 months, when the share of unemployed in education was higher than 1 promille, or 0.1 %. After March 2015, there was slight increase and most of the months had this share higher than 0.5 %. This was almost exclusively due the project RE-PAS.
| región | BA | TT | TN | NR | ZA | BB | PO | KE | NRO12 | NRO20 | SR |
|---|---|---|---|---|---|---|---|---|---|---|---|
| 2004 | 13.17 | 8.6 | 9.66 | 5.19 | 4.5 | 7.27 | 4.85 | 5.32 | 5.35 | 4.84 | 6.28 |
| 2005 | 30.46 | 16.21 | 15.41 | 7.77 | 10.03 | 7.75 | 7.38 | 6.87 | 6.87 | 6.5 | 9.53 |
| 2006 | 17.01 | 6.63 | 6.7 | 2.2 | 3.38 | 3.35 | 2.39 | 3.63 | 3.47 | 3.09 | 3.94 |
| 2007 | 20.58 | 5.3 | 3.29 | 3.06 | 3.61 | 2.45 | 2.27 | 4.09 | 3.72 | 3.01 | 3.73 |
| 2008 | 25.38 | 7.97 | 6 | 4.77 | 5.77 | 3.3 | 2.65 | 5.85 | 3.86 | 4.05 | 5.25 |
| 2009 | 6.77 | 4.5 | 3.79 | 2.11 | 3.14 | 2.55 | 1.7 | 1.38 | 1.68 | 1.63 | 2.53 |
| 2010 | 6.13 | 2.22 | 2.72 | 0.89 | 1.93 | 1.71 | 0.49 | 0.45 | 1.17 | 0.86 | 1.47 |
| 2011 | 1.24 | 0.57 | 0.68 | 0.08 | 0.18 | 0.34 | 0.02 | 0.09 | 0.27 | 0.18 | 0.27 |
| 2012 | 0.06 | 0.29 | 0.48 | 0.91 | 0.13 | 0.49 | 0.04 | 0.04 | 0.14 | 0.1 | 0.29 |
| 2013 | 0.18 | 0.36 | 0.42 | 0.33 | 0.57 | 0.17 | 0.2 | 0.18 | 0.12 | 0.13 | 0.27 |
| 2014 | 2.18 | 2.49 | 1.35 | 1.37 | 2.09 | 1.33 | 1 | 1.2 | 0.86 | 0.85 | 1.46 |
| 2015 | 5.88 | 5.71 | 5.75 | 5.97 | 6.72 | 5.26 | 4.69 | 4.05 | 4.45 | 4.14 | 5.25 |
| 2016 | 6.06 | 5.52 | 7.3 | 5.59 | 7.78 | 4.74 | 4.41 | 5.15 | 3.9 | 4.01 | 5.47 |
| 2017 | 3.87 | 10.97 | 9.04 | 9.84 | 11.76 | 8.64 | 7.76 | 8.32 | 7.62 | 7.27 | 8.64 |
| 2018 | 6.41 | 20.69 | 20.69 | 26.56 | 23.38 | 30.01 | 19.36 | 19.08 | 22.27 | 21.13 | 21.55 |
| 2019 | 7.4 | 17.05 | 21.14 | 23.81 | 22.87 | 33.4 | 20.86 | 25.32 | 27.89 | 26.85 | 23.3 |
| 2020 | 3.86 | 5.57 | 6.33 | 7.2 | 6.49 | 10.89 | 8.97 | 9.01 | 10.02 | 9.73 | 8.11 |
| 2021 | 1.36 | 2.46 | 1.62 | 1.53 | 2.69 | 2.92 | 2.78 | 1.59 | 2.03 | 1.99 | 2.21 |
| 2022 | 4.56 | 4.19 | 4.67 | 3.18 | 5.63 | 4.15 | 5.15 | 3.3 | 3.36 | 3.58 | 4.35 |
| 2023 | 4.14 | 4.13 | 4.55 | 3.48 | 5.33 | 3.72 | 4.03 | 3.08 | 3.04 | 3.13 | 3.92 |
| 2024 | 4.27 | 4.07 | 5.59 | 3.97 | 5.16 | 3.43 | 3.98 | 2.48 | 2.55 | 2.87 | 3.86 |
| 2025 | 7.78 | 10.73 | 12.24 | 10.85 | 12.88 | 8.15 | 9.07 | 6.97 | 6.55 | 6.92 | 9.29 |
| 2026 | 6.09 | 6.99 | 7.85 | 7.82 | 7.51 | 5.8 | 6.27 | 4.98 | 4.98 | 5.11 | 6.37 |
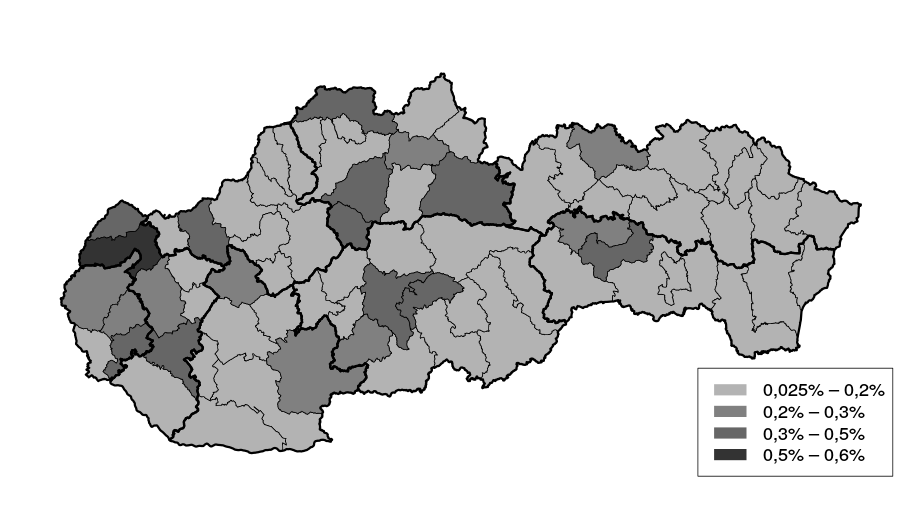
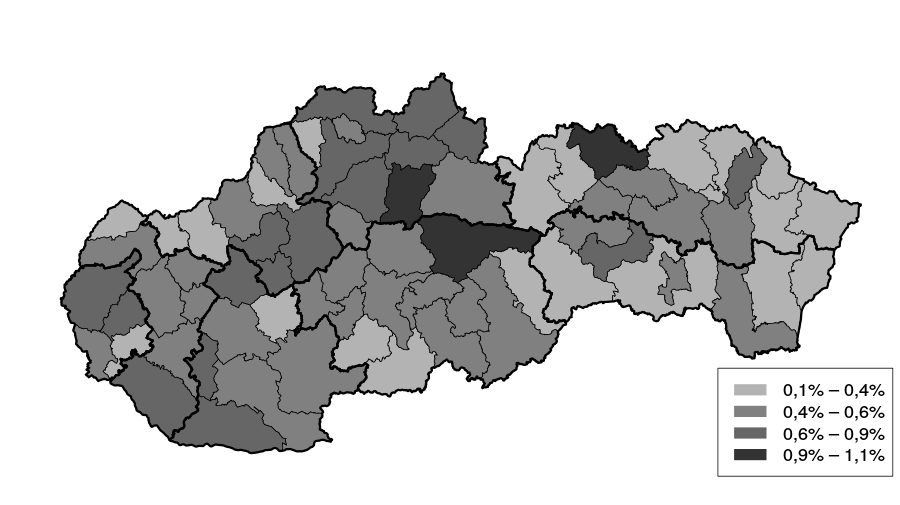
Regional structure of the share of unemployed in education
Regional structure of the share of unemployed in education, averages of year 2014 and 2015 in the districts of Slovakia.
Education and labour market
Slovakia suffers from weak connections between education and labour market, which results in high unemployment of graduates and young people.. . .
 Share
Share Facebook
 Twitter
 News
News