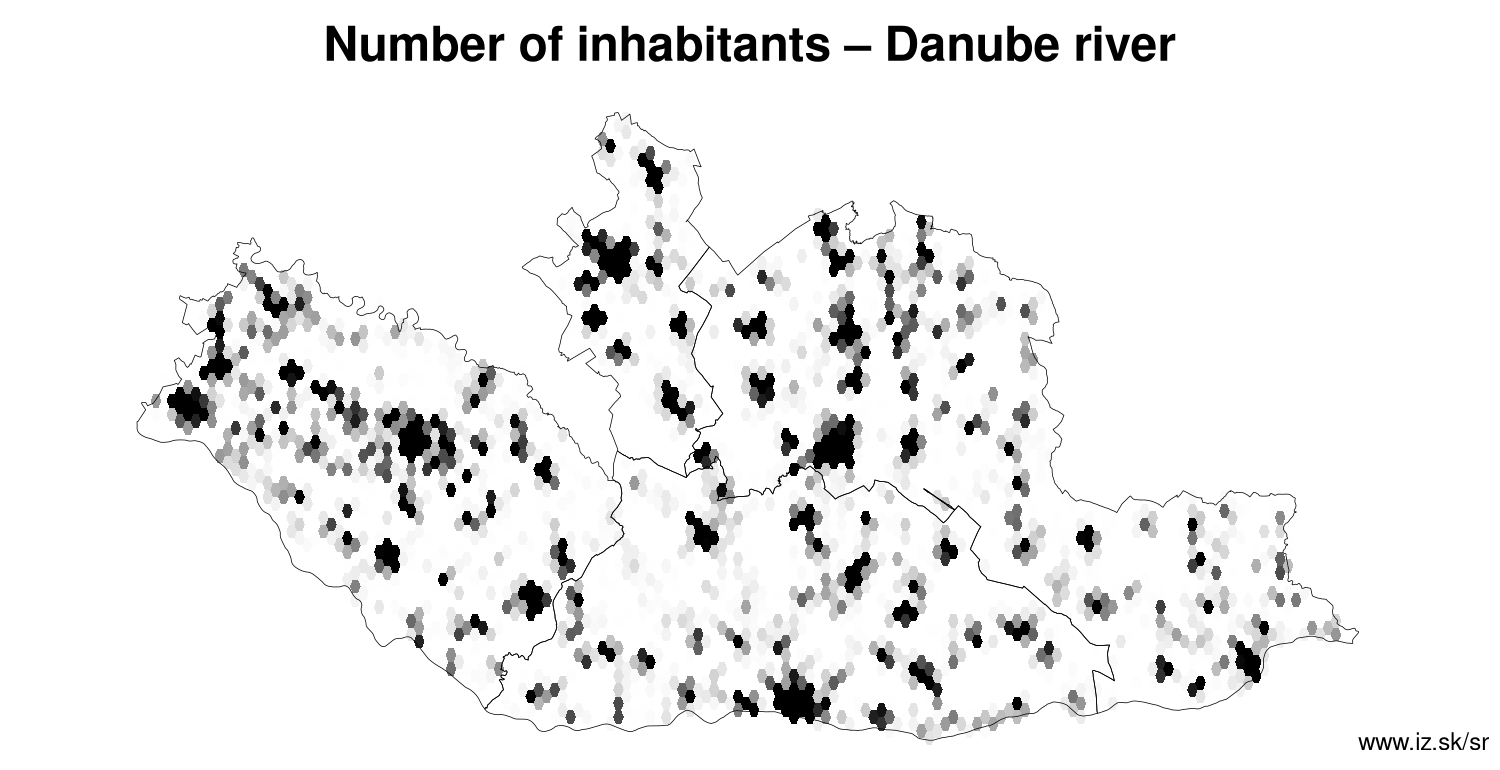
Region Danube river
consists of counties:
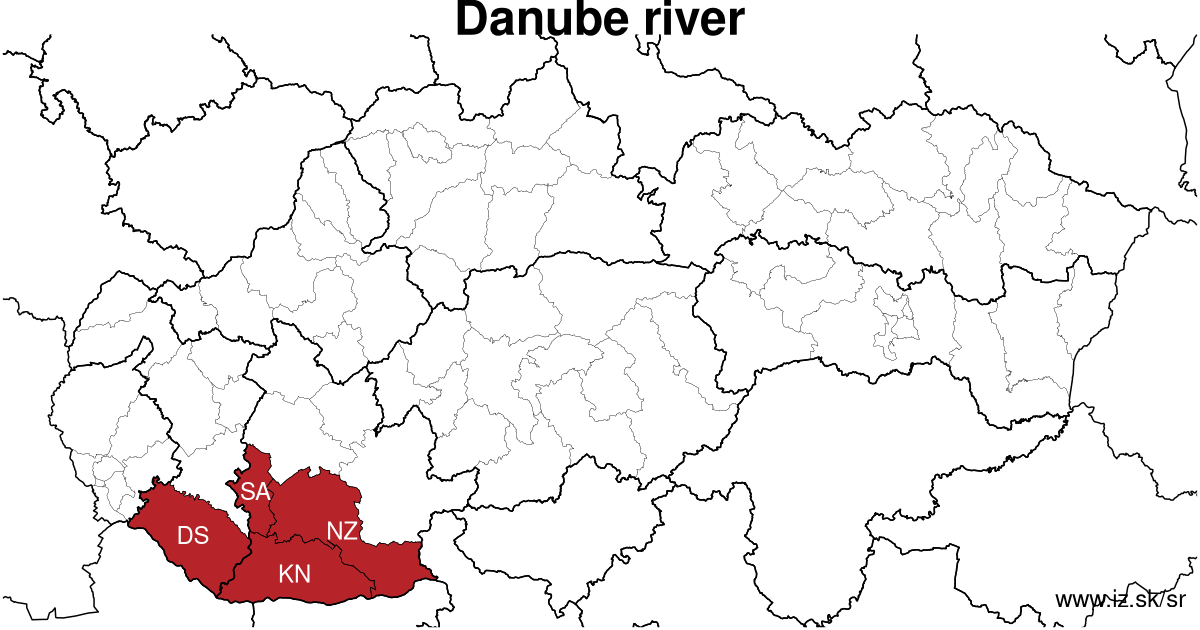
Towns
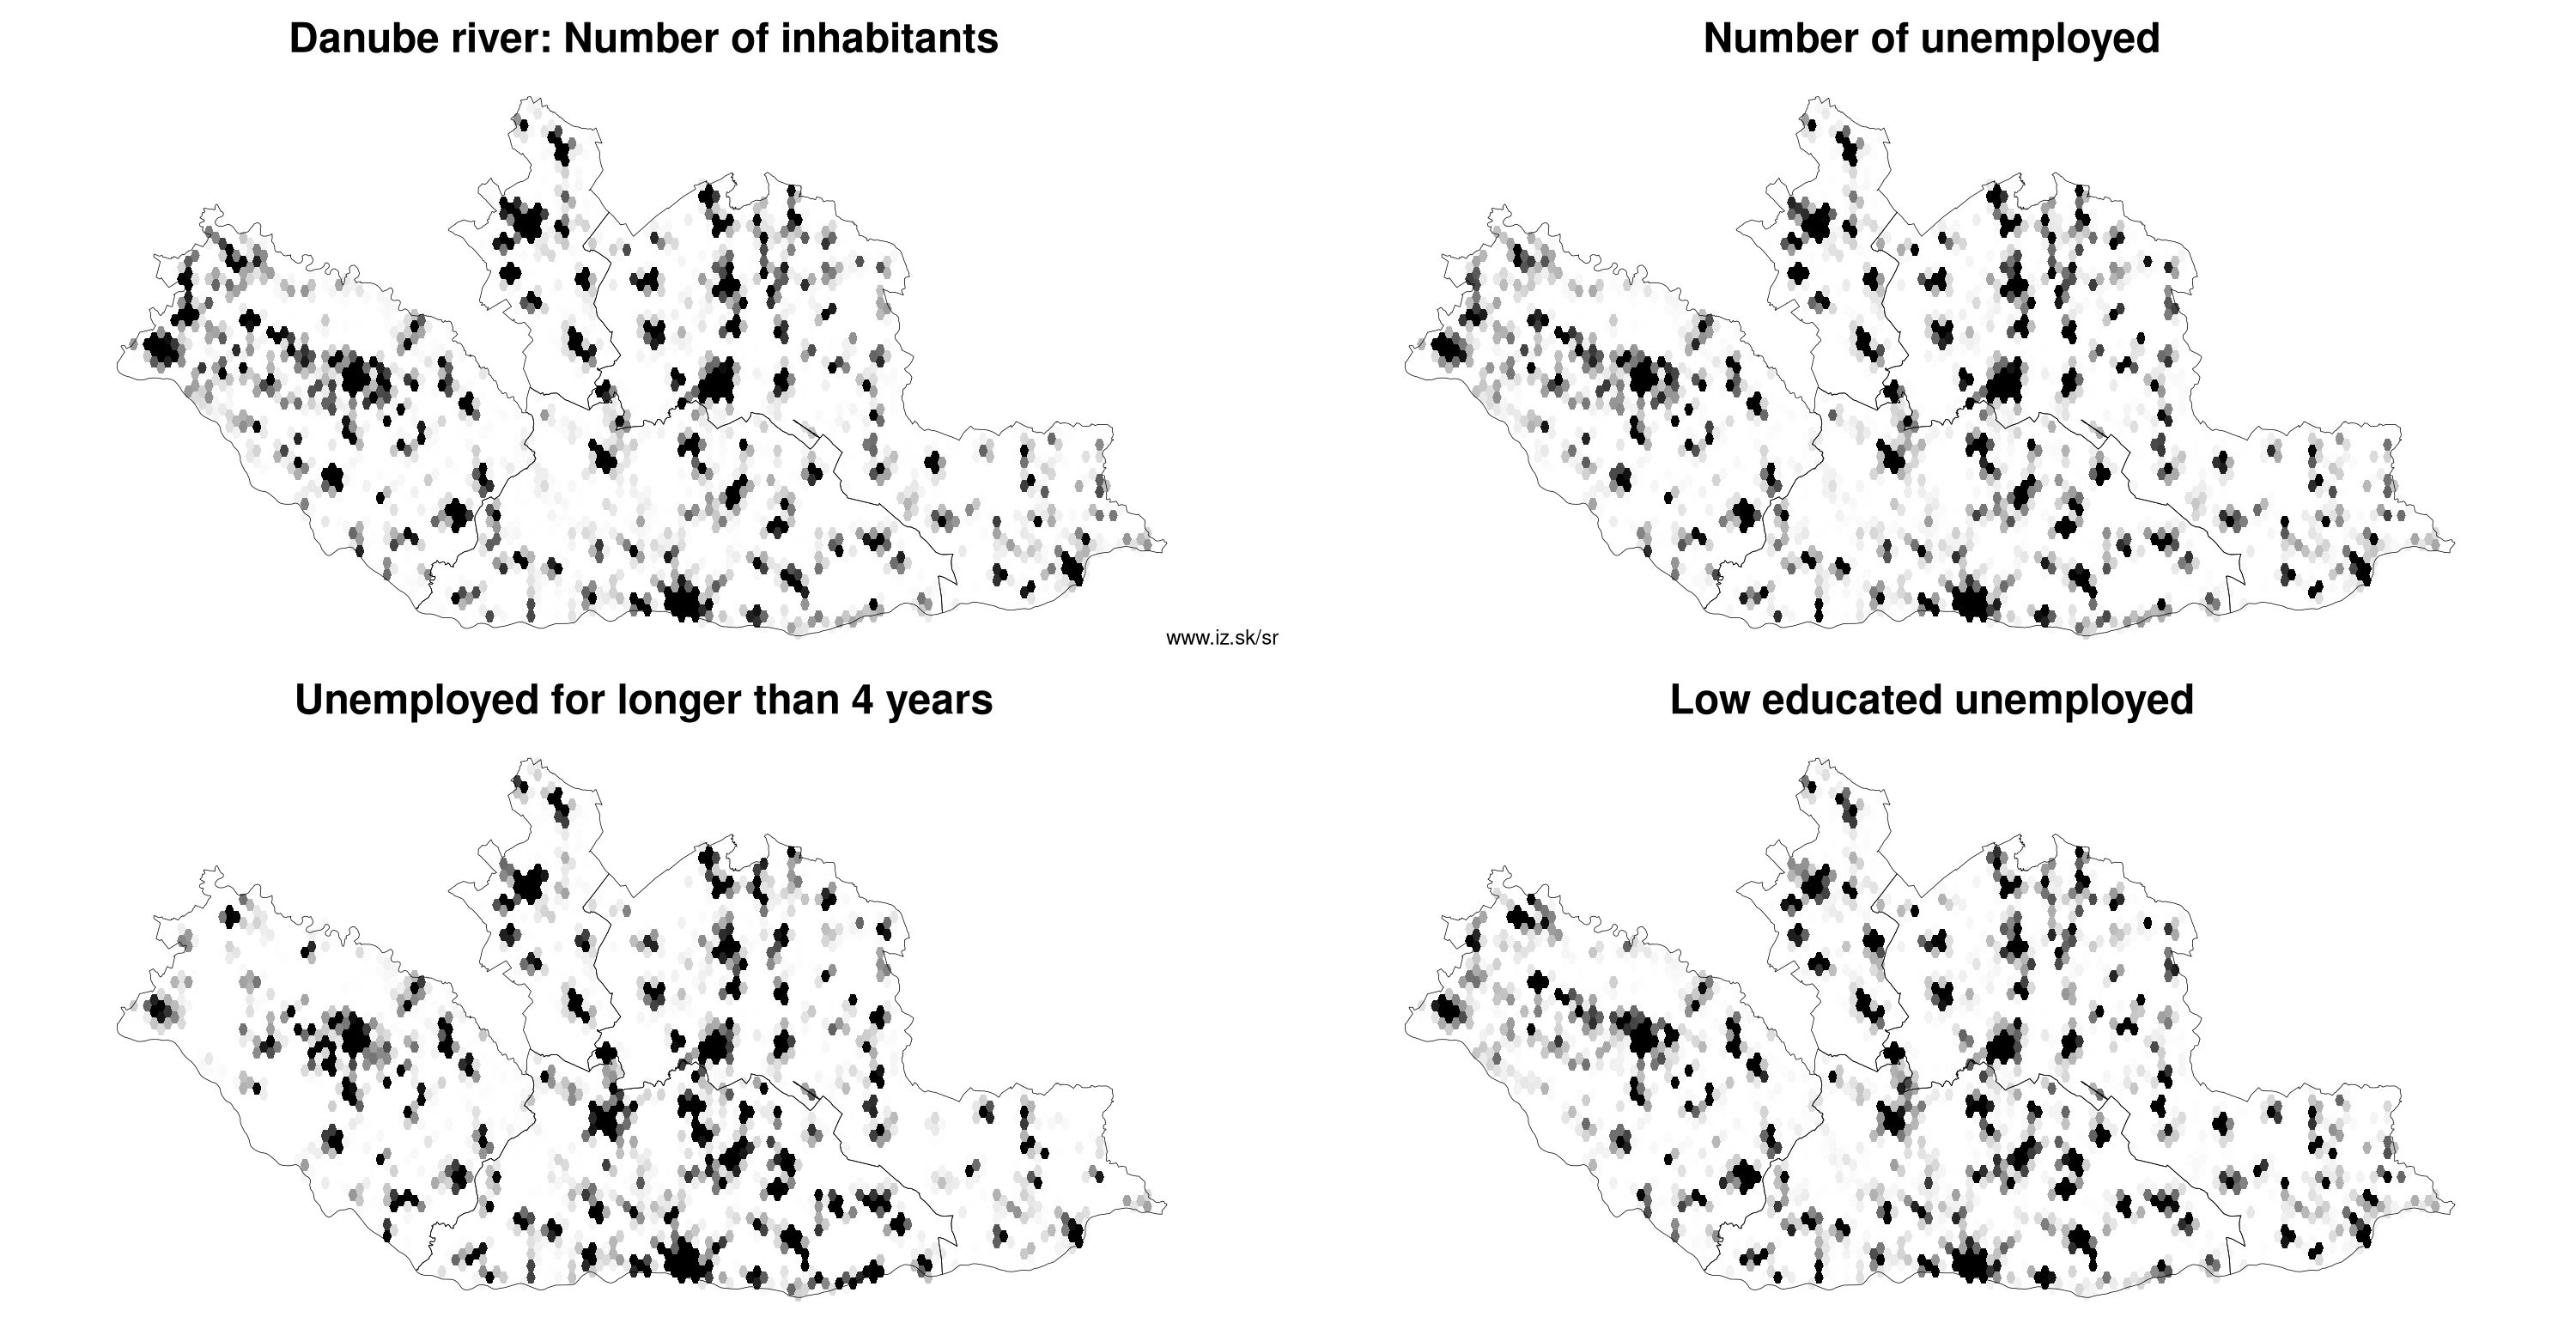
Region Danube river contains cities Dunajská Streda, Gabčíkovo, Hurbanovo, Kolárovo, Komárno, Nové Zámky, Šaľa, Šamorín, Štúrovo, Šurany, Veľký Meder and 172 villages. Statistics on city level on unemployment are for the period of 2026-04-01, for population are fore yar 2025.
name | number of inhabitants in economically active age | number of unemployed number of unemployed women number of long-term unemployed | unemployment rate unemployment rate of women long-term unemployment rate |
|---|---|---|---|
 Nové Zámky | 35 628 22 943 | 799 444 229 | 3.5 % 3.8 % 1 % |
 Komárno | 31 560 20 532 | 704 387 181 | 3.4 % 3.8 % 0.9 % |
 Dunajská Streda | 22 720 14 608 | 554 304 103 | 3.8 % 4.1 % 0.7 % |
 Šaľa | 19 534 12 929 | 429 243 85 | 3.3 % 3.8 % 0.7 % |
 Šamorín | 13 622 8 825 | 219 125 23 | 2.5 % 2.8 % 0.3 % |
 Kolárovo | 10 381 6 933 | 380 220 129 | 5.5 % 6.7 % 1.9 % |
 Štúrovo | 9 221 5 940 | 178 105 42 | 3 % 3.6 % 0.7 % |
 Šurany | 9 001 5 877 | 240 134 65 | 4.1 % 4.7 % 1.1 % |
 Veľký Meder | 8 163 5 354 | 162 97 32 | 3 % 3.6 % 0.6 % |
 Hurbanovo | 7 111 4 637 | 207 116 64 | 4.5 % 5.2 % 1.4 % |
 Gabčíkovo | 5 300 3 537 | 102 63 23 | 2.9 % 3.7 % 0.7 % |
Villages with over 2000 inhabitants are Tvrdošovce (5062), Dvory nad Žitavou (4979), Nesvady (4963), Močenok (4306), Komjatice (4210), Palárikovo (4203), Marcelová (3794), Hviezdoslavov (3772), Okoč (3661), Tešedíkovo (3621), Bánov (3548), Zlaté Klasy (3542), Lehnice (3323), Bátorove Kosihy (3291), Neded (3174), Vlčany (3131), Topoľníky (3122), Vrakúň (2946), Veľký Kýr (2931), Selice (2846), Trnovec nad Váhom (2757), Svätý Peter (2700), Pribeta (2635), Zlatná na Ostrove (2380), Diakovce (2377), Svodín (2354), Nový Život (2302), Horná Potôň (2260), Zemianska Olča (2248), Trhová Hradská (2160), Holice (2143), Zemné (2112), Kvetoslavov (2110), Gbelce (2051).
| villages by number of inhabitants | ||||||
|---|---|---|---|---|---|---|
| total | up to 300 | 300 to 500 | 500 to 1000 | 1000 to 1500 | over 1500 | |
| 172 | 8 | 24 | 45 | 38 | 57 | |
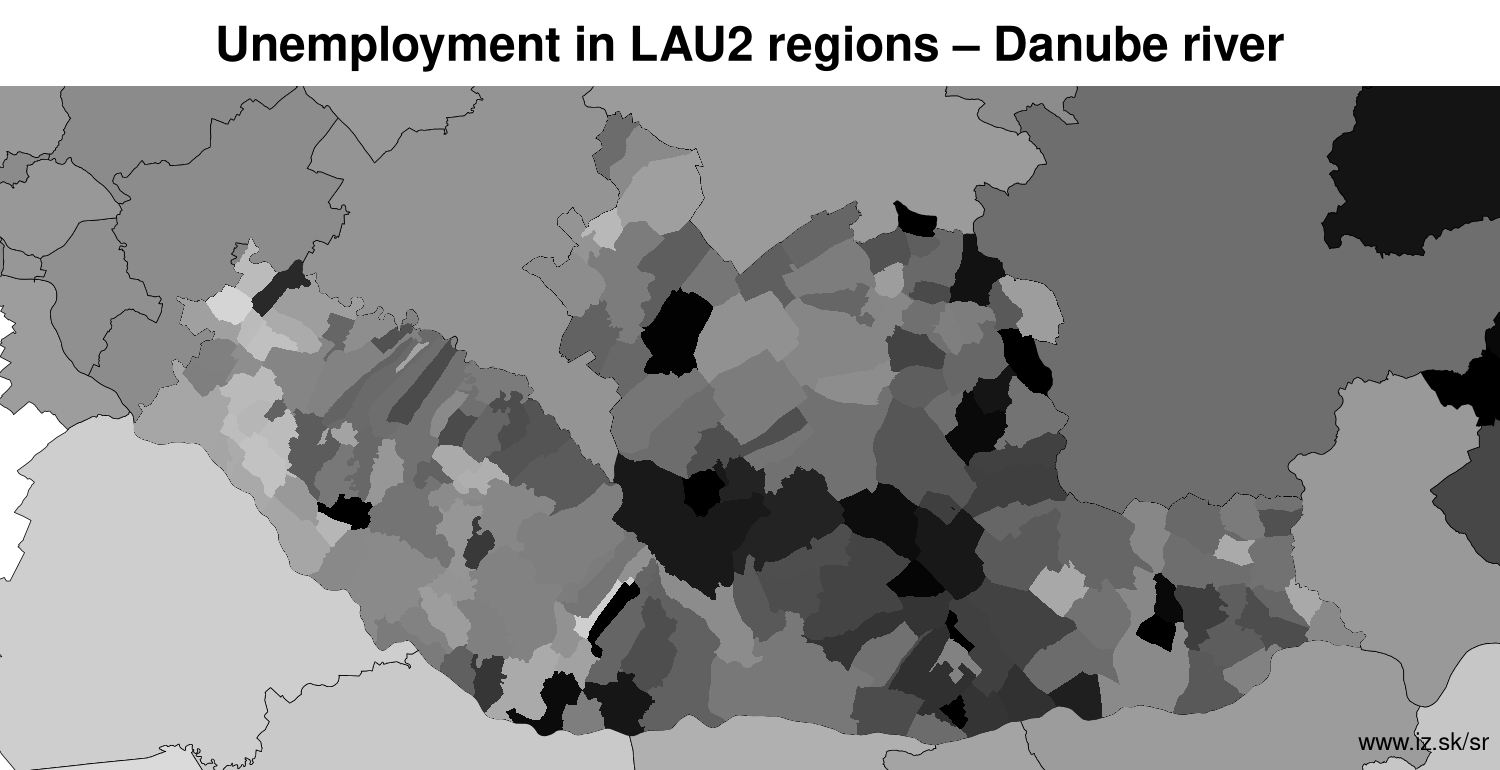
Unemployment
| rok | 2012 | 2014 | 2016 | 2018 | 2019 | 2020 | 2021 | 2022 | 2023 | 2024 | 2025 | 2026 |
|---|---|---|---|---|---|---|---|---|---|---|---|---|
| number of unemployed | 33 790 | 29 247 | 21 470 | 9611 | 8466 | 12 656 | 13 895 | 11 338 | 9761 | 9562 | 9634 | 10 076 |
| number of long-term unemployed | 15 809 | 15 169 | 10 278 | 2880 | 1987 | 2433 | 4411 | 3975 | 2856 | 2533 | 2299 | 2344 |
| number of people receiving social benefits | 26 397 | 22 606 | 14 200 | 8193 | 6646 | 6049 | 5475 | 5603 | 5494 | 5168 | 4707 | 4730 |
| number of activational workers | 1999 | 2013 | 1290 | 428 | 264 | 252 | 235 | 221 | 64.9 | 104 | 102 | 21.2 |
| unemployment rate | 11.1 | 9.7 | 7.3 | 3.3 | 3 | 4.5 | 5 | 4.1 | 3.6 | 3.5 | 3.6 | 3.7 |
| long-term unemployment rate | 5.2 | 5.1 | 3.5 | 1.0 | 0.7 | 0.9 | 1.6 | 1.4 | 1.0 | 0.9 | 0.8 | 0.9 |
| vacancies | 400 | 601 | 2277 | 4196 | 6132 | 5110 | 4477 | 4484 | 4506 | 5077 | 8654 | 11 567 |
Demographics
| 2012 | 2014 | 2016 | 2018 | 2019 | 2020 | 2021 | 2022 | 2023 | 2024 | 2025 | 2026 | |
|---|---|---|---|---|---|---|---|---|---|---|---|---|
| number of inhabitants | 418 112 | 416 956 | 415 955 | 415 048 | 414 470 | 413 434 | 413 423 | 412 407 | 411 685 | 410 858 | 409 498 | 409 498 |
| assignation tax | 85 541 295 | 89 030 031 | 106 098 015 | 129 335 822 | 145 582 558 | 150 369 285 | 144 347 652 | 159 447 754 | 178 972 128 | 179 528 667 | 147 336 734 | 158 432 416 |
| demographic dependency | 20.8 | 22.1 | 24.1 | 26.4 | 27.7 | 28.8 | 29.3 | 30.4 | 31.5 | 32.4 | 33.4 | |
| number of employed foreigners | 1139 | 1723 | 2450 | 3900 | 4614 | 5309 | 5022 | 5672 | 6885 | 7641 | 8916 | 11 249 |
Number of unemployed
| rok | 2012 | 2014 | 2016 | 2018 | 2019 | 2020 | 2021 | 2022 | 2023 | 2024 | 2025 | 2026 |
|---|---|---|---|---|---|---|---|---|---|---|---|---|
| less than 24 years | 6780 | 4609 | 2664 | 1004 | 917 | 1483 | 1572 | 1224 | 1098 | 1115 | 1214 | 1283 |
| 25 to 39 years | 14 471 | 10 252 | 7441 | 3046 | 2648 | 4129 | 4378 | 3577 | 2961 | 2898 | 2846 | 2958 |
| 40 to 54 years | 13 215 | 10 012 | 7530 | 3370 | 2951 | 4399 | 4870 | 4019 | 3529 | 3523 | 3553 | 3744 |
| 55 years and more | 5187 | 4374 | 3835 | 2191 | 1950 | 2645 | 3075 | 2518 | 2173 | 2025 | 2020 | 2212 |
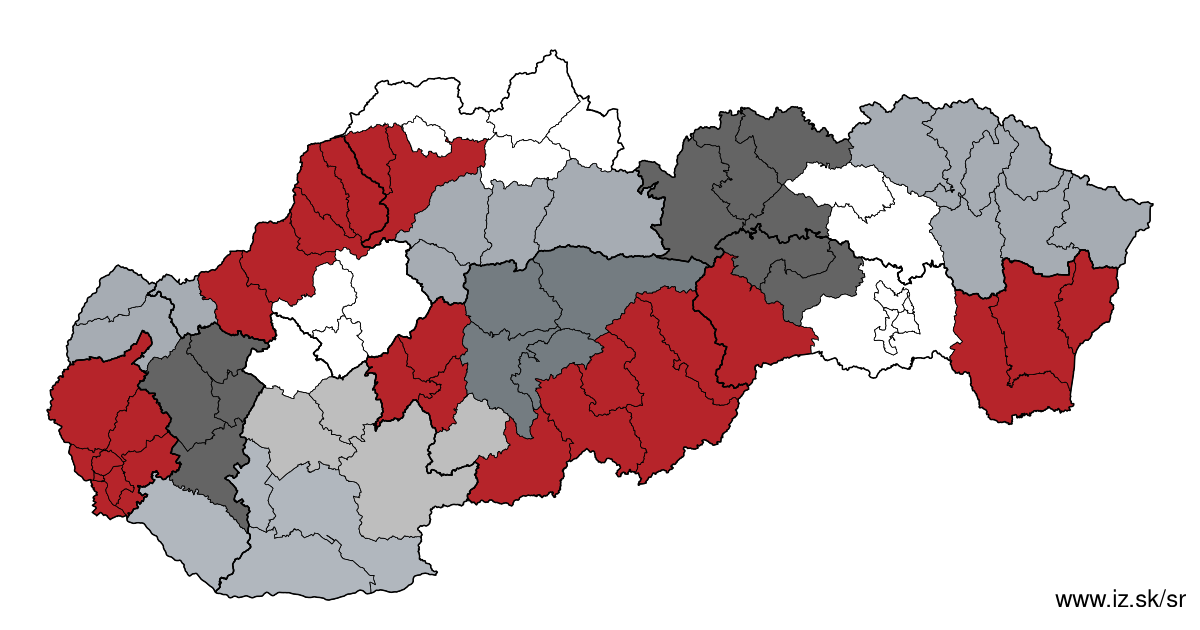
Other regions
- Basic data on Slovak regions
- Labour market indicators of slovak regions.
- Region Bratislava and surroundings
- Region Kopanice
- Region Danube river
- Region lower Vah river
- Region middle Vár river
- Region upper Nitra river
- Region lower Nitra river
- Region Mining cities
- Region Kysuce a Orava
- Region upper Vah river – Liptov
- Region Spiš cities
- Region upper Hron river
- Region Juhoslovenská kotlina
- Region Košice fold and Torysa river
- Region upper Zemplín
- Region lower Zemplín
Suggested citation: Michal Páleník: Regions of Slovakia - Region Danube river, IZ Bratislava, retrieved from: https://www.iz.sk/en/projects/regions-of-slovakia/danube-river
Regions of the Slovak Republic
Due to the need of analysis we have created regions of Slovakia. We will bring more information about these regions from the macroeconomic point of view as well as from the point of view of the labour market.. . .
 Share
Share Facebook
 Twitter
 News
News