Bratislava
consists of counties:
Towns
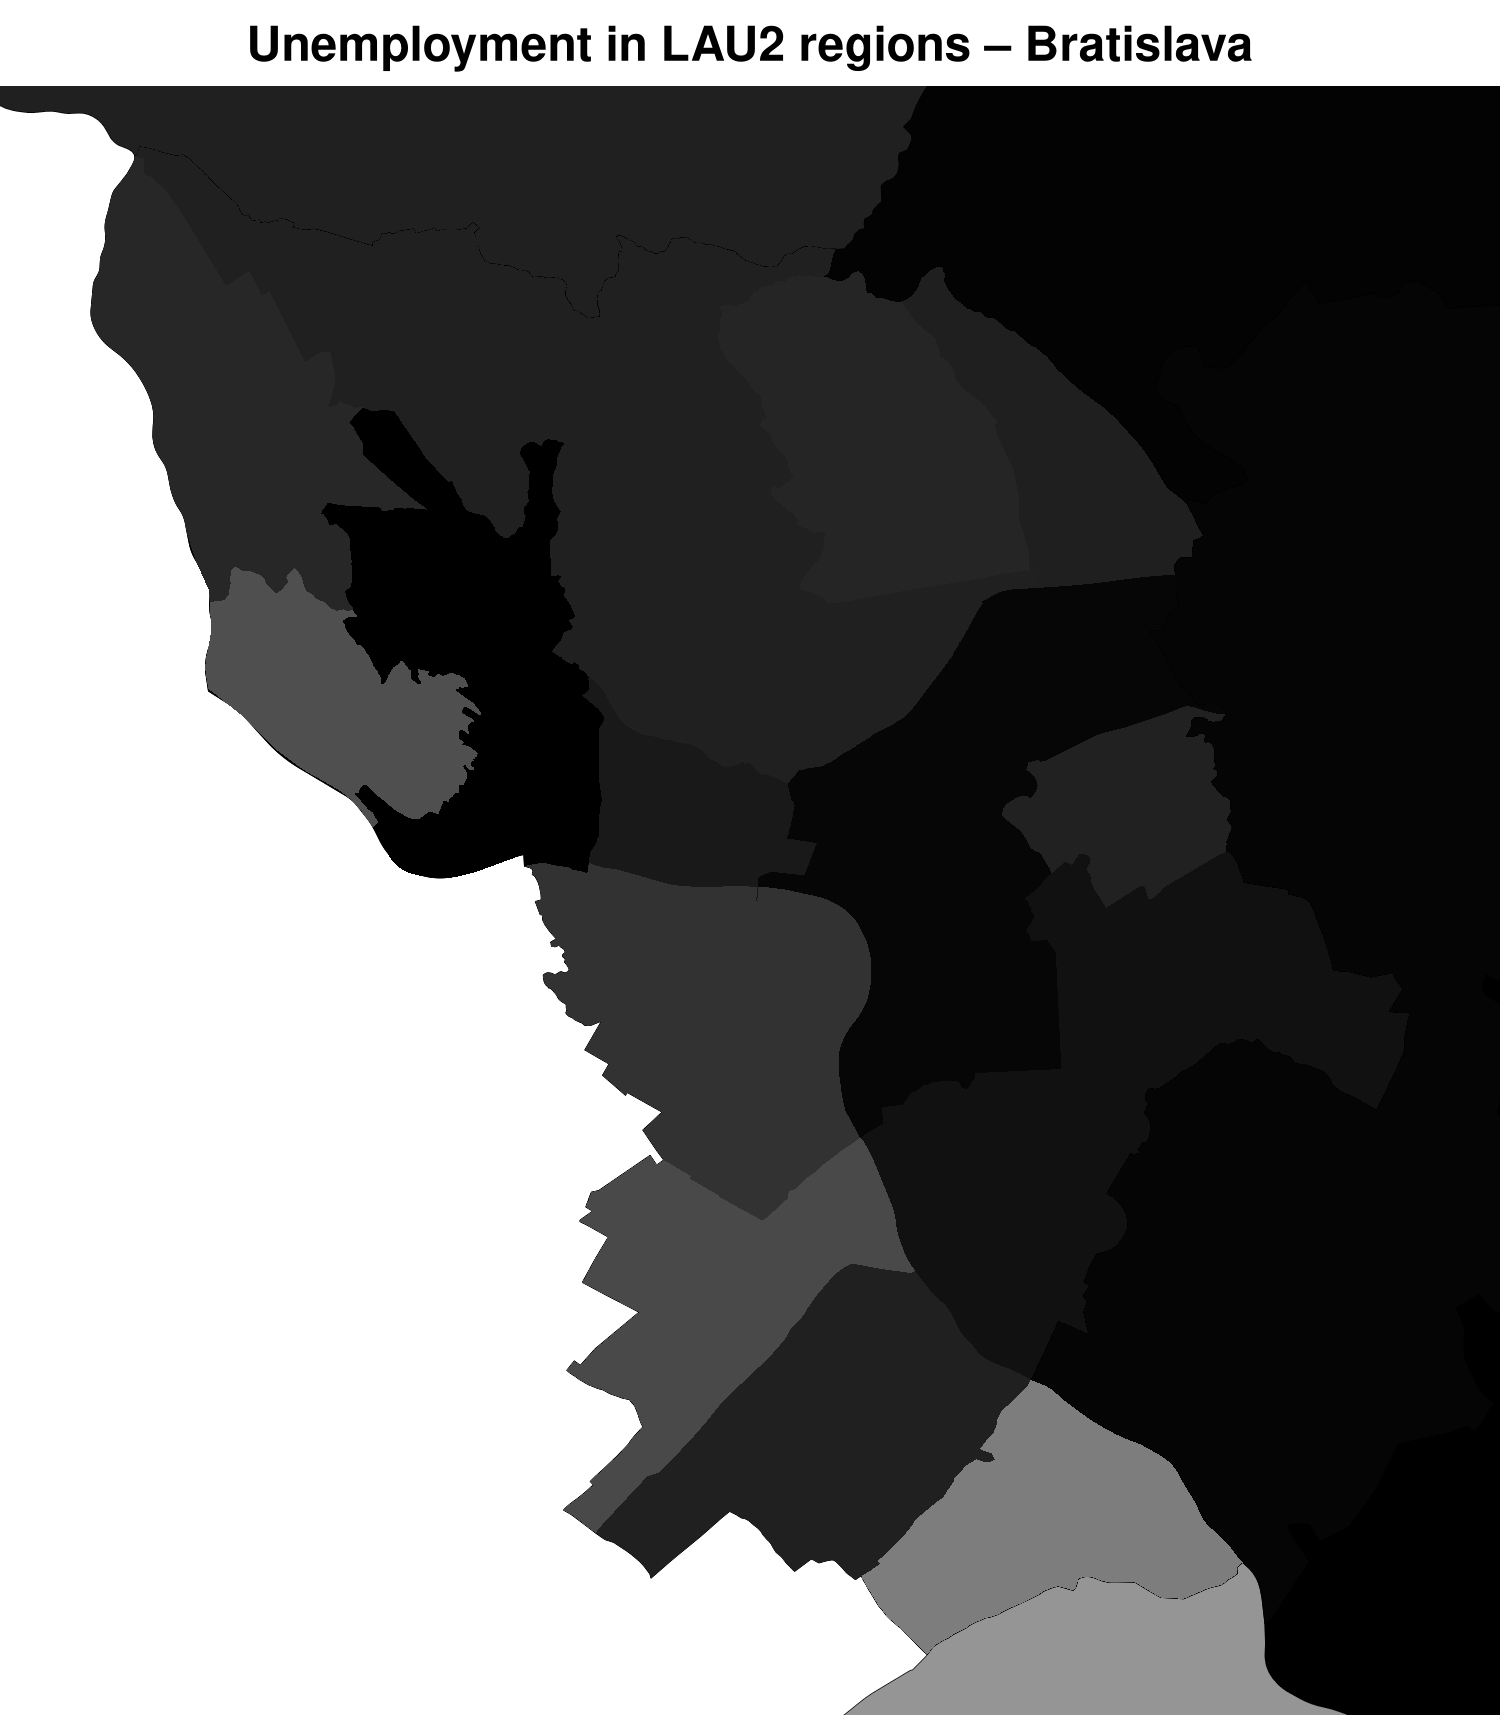
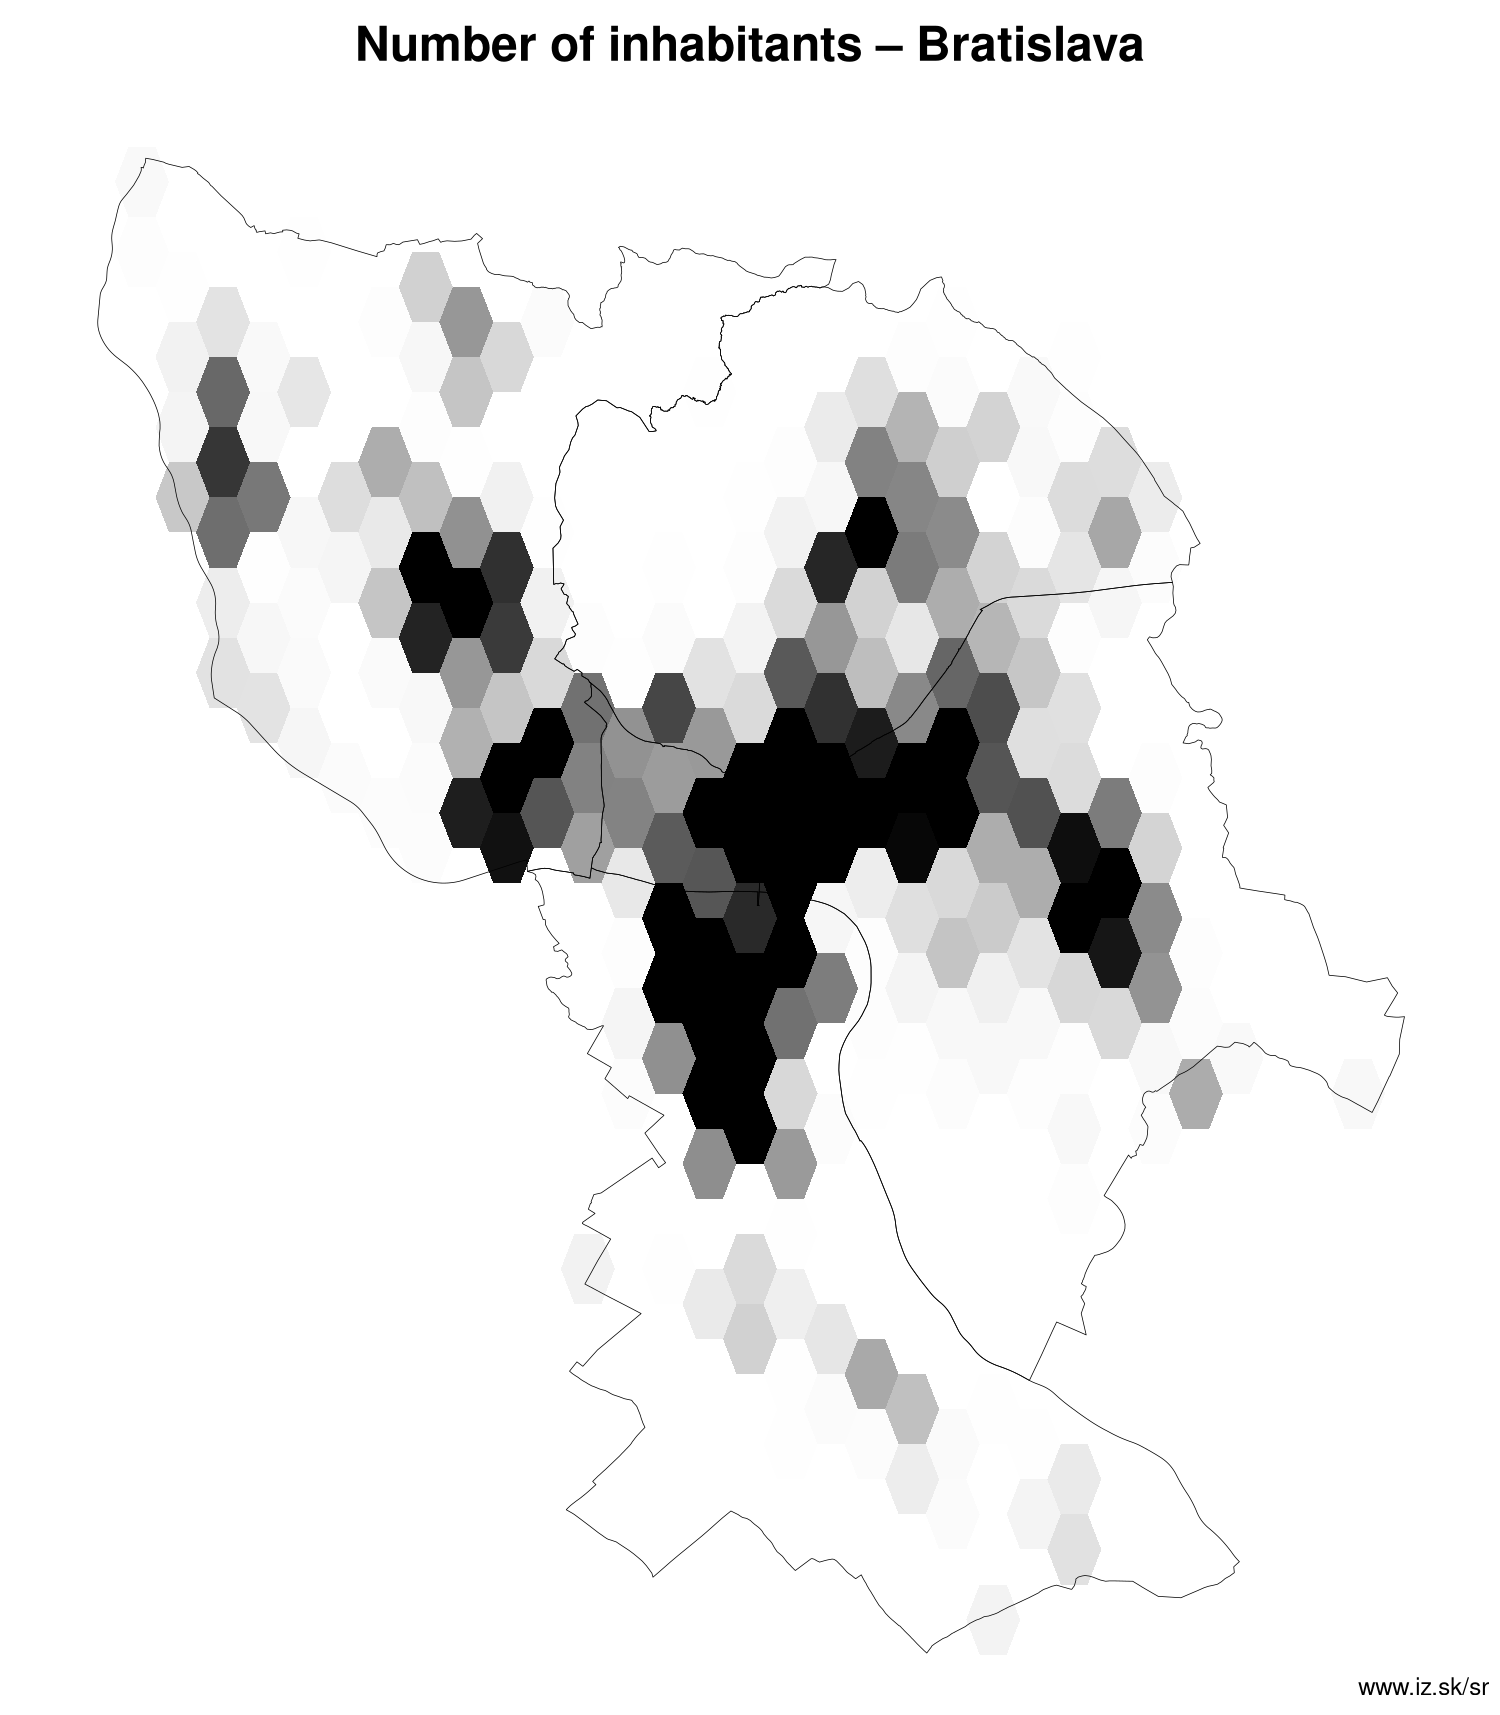
Region Bratislava contains cities Bratislava-Čunovo, Bratislava-Devín, Bratislava-Devínska Nová Ves, Bratislava-Dúbravka, Bratislava-Jarovce, Bratislava-Karlova Ves, Bratislava-Lamač, Bratislava-Nové Mesto, Bratislava-Petržalka, Bratislava-Podunajské Biskupice, Bratislava-Rača, Bratislava-Rusovce, Bratislava-Ružinov, Bratislava-Staré Mesto, Bratislava-Vajnory, Bratislava-Vrakuňa, Bratislava-Záhorská Bystrica and 0 villages. More on oma.sk. Statistics on city level on unemployment are for the period of 2026-06-01, for population are fore yar 2025.
name | number of inhabitants in economically active age | number of unemployed number of unemployed women number of long-term unemployed | unemployment rate unemployment rate of women long-term unemployment rate |
|---|---|---|---|
 Bratislava-Petržalka | 112 118 68 257 | 1 918 1 014 307 | 2.8 % 3 % 0.4 % |
 Bratislava-Ružinov | 84 233 55 062 | 1 599 908 336 | 2.9 % 3.2 % 0.6 % |
 Bratislava-Staré Mesto | 47 896 30 510 | 786 450 157 | 2.6 % 3 % 0.5 % |
 Bratislava-Nové Mesto | 45 966 30 127 | 846 487 151 | 2.8 % 3.2 % 0.5 % |
 Bratislava-Dúbravka | 35 300 22 670 | 758 414 192 | 3.3 % 3.7 % 0.8 % |
 Bratislava-Karlova Ves | 34 746 23 528 | 774 395 216 | 3.3 % 3.3 % 0.9 % |
 Bratislava-Rača | 26 686 17 725 | 511 270 107 | 2.9 % 3.2 % 0.6 % |
 Bratislava-Podunajské Biskupice | 22 998 15 029 | 459 267 99 | 3.1 % 3.5 % 0.7 % |
 Bratislava-Vrakuňa | 20 178 13 635 | 385 206 58 | 2.8 % 3 % 0.4 % |
 Bratislava-Devínska Nová Ves | 17 128 11 712 | 353 182 77 | 3 % 3.1 % 0.7 % |
 Bratislava-Lamač | 7 888 4 645 | 172 93 49 | 3.7 % 4 % 1.1 % |
 Bratislava-Záhorská Bystrica | 8 009 5 108 | 132 78 23 | 2.6 % 3 % 0.5 % |
 Bratislava-Vajnory | 6 011 3 968 | 96 52 17 | 2.4 % 2.7 % 0.4 % |
 Bratislava-Rusovce | 4 504 2 892 | 65 31 7 | 2.2 % 2.1 % 0.2 % |
 Bratislava-Jarovce | 3 246 2 016 | 44 26 2 | 2.2 % 2.6 % 0.1 % |
 Bratislava-Devín | 2 165 1 356 | 41 22 13 | 3 % 3.2 % 1 % |
 Bratislava-Čunovo | 1 830 1 140 | 23 17 1 | 2 % 3 % 0.1 % |
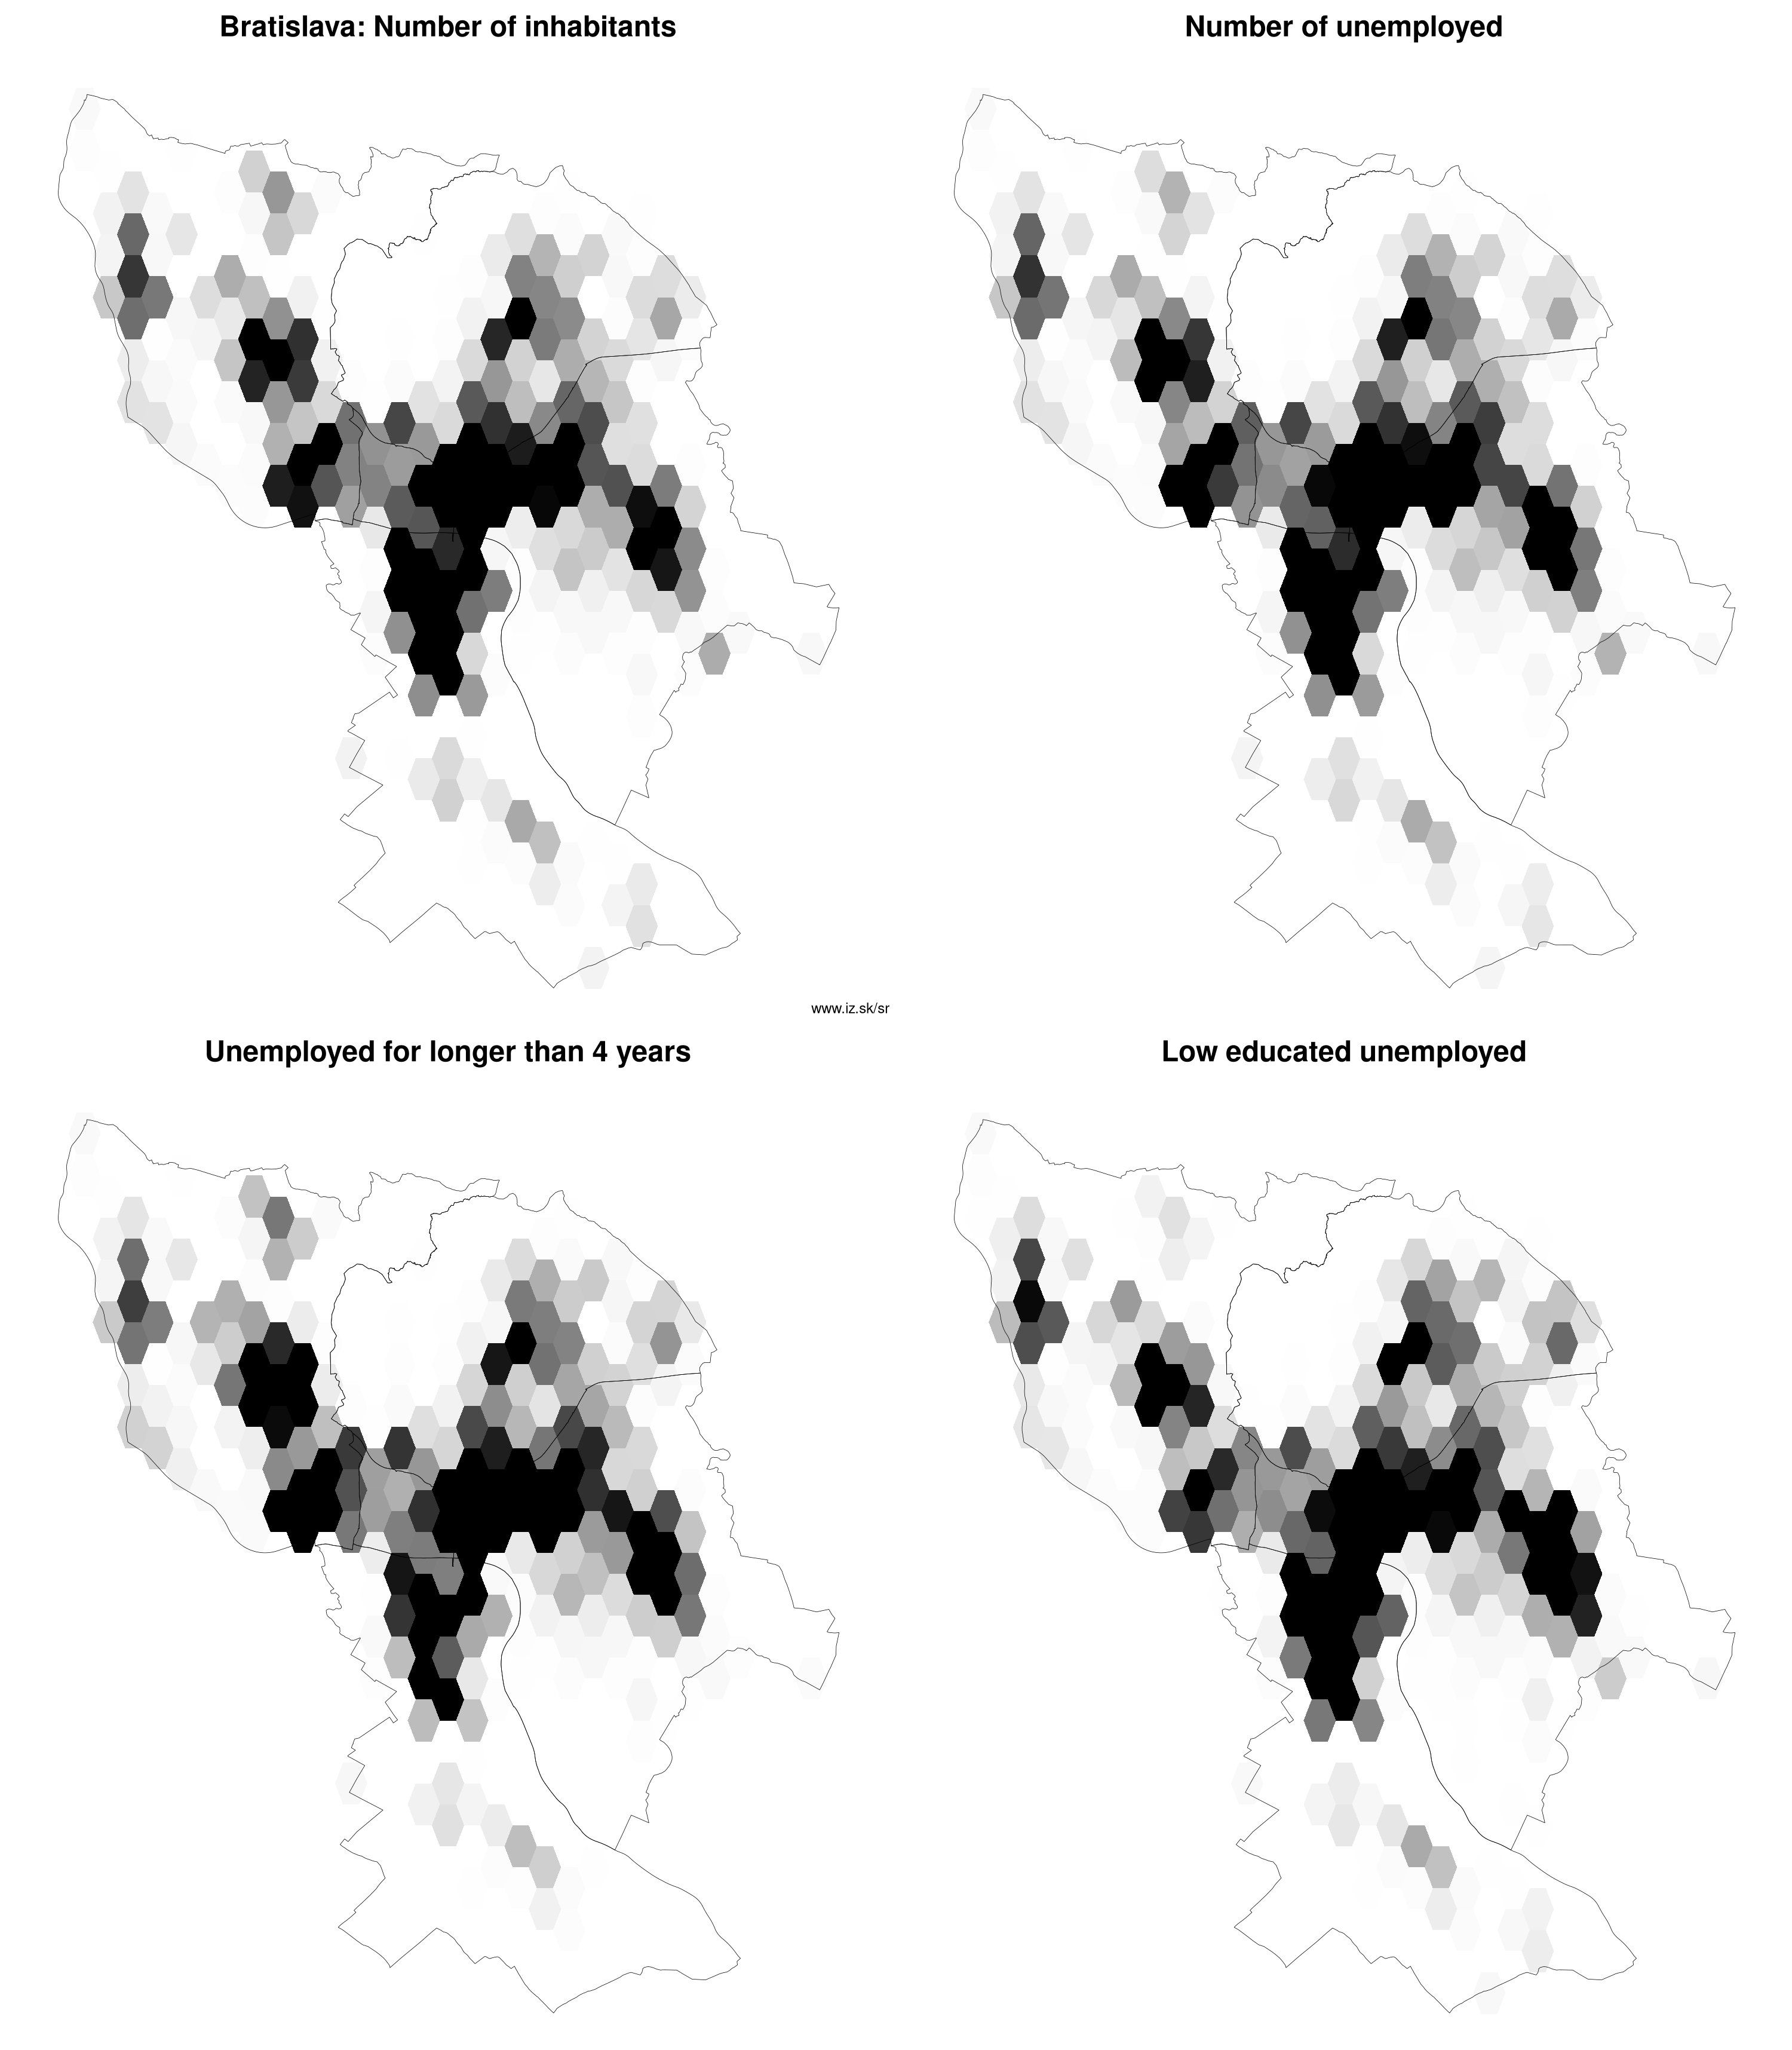
Unemployment
| rok | 2012 | 2014 | 2016 | 2018 | 2019 | 2020 | 2021 | 2022 | 2023 | 2024 | 2025 | 2026 |
|---|---|---|---|---|---|---|---|---|---|---|---|---|
| number of unemployed | 12 744 | 14 060 | 11 842 | 7498 | 7401 | 9886 | 11 682 | 8532 | 7937 | 8350 | 8815 | 9031 |
| number of long-term unemployed | 3703 | 5130 | 4285 | 1766 | 1480 | 1864 | 3513 | 2696 | 1961 | 1577 | 1535 | 1740 |
| number of people receiving social benefits | 3240 | 2663 | 1345 | 844 | 746 | 795 | 869 | 3063 | 5430 | 5106 | 3243 | 2622 |
| number of activational workers | 12.1 | 5.7 | 0 | 0.4 | 0.7 | 1 | 0.9 | 0.4 | 0 | 0 | 0 | 0 |
| unemployment rate | 4.3 | 4.8 | 4.1 | 2.6 | 2.6 | 3.5 | 3.8 | 2.8 | 2.6 | 2.7 | 2.8 | 2.9 |
| long-term unemployment rate | 1.2 | 1.8 | 1.5 | 0.6 | 0.5 | 0.7 | 1.1 | 0.9 | 0.6 | 0.5 | 0.5 | 0.6 |
| vacancies | 829 | 1025 | 6187 | 17 355 | 20 556 | 16 945 | 16 225 | 19 557 | 25 404 | 30 930 | 36 601 | 45 999 |
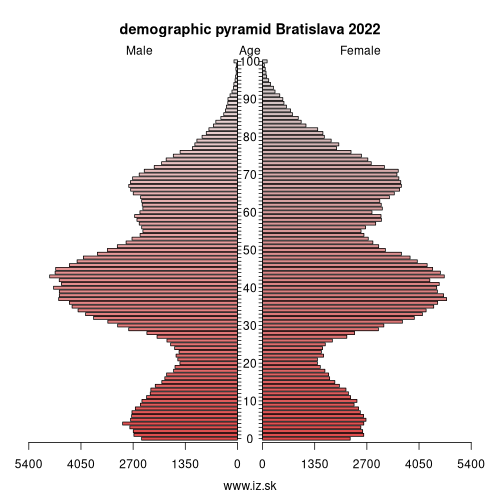
Demographics
| 2012 | 2014 | 2016 | 2018 | 2019 | 2020 | 2021 | 2022 | 2023 | 2024 | 2025 | 2026 | |
|---|---|---|---|---|---|---|---|---|---|---|---|---|
| number of inhabitants | 415 589 | 419 678 | 425 923 | 432 864 | 437 726 | 440 948 | 475 577 | 476 922 | 478 040 | 479 389 | 480 902 | 480 902 |
| assignation tax | 136 225 895 | 137 451 202 | 168 385 158 | 213 023 237 | 243 900 760 | 254 158 877 | 246 978 170 | 275 363 135 | 329 105 684 | 331 942 073 | 290 032 220 | 311 401 786 |
| demographic dependency | 22.5 | 24.3 | 26.6 | 28.9 | 30 | 31.1 | 31.5 | 32.4 | 33.2 | 33.8 | 34.3 | |
| number of employed foreigners | 4765 | 5560 | 9500 | 18 165 | 22 693 | 20 970 | 21 636 | 23 960 | 30 298 | 36 224 | 45 127 | 52 798 |
Number of unemployed
| rok | 2012 | 2014 | 2016 | 2018 | 2019 | 2020 | 2021 | 2022 | 2023 | 2024 | 2025 | 2026 |
|---|---|---|---|---|---|---|---|---|---|---|---|---|
| less than 24 years | 2291 | 1842 | 1209 | 580 | 570 | 805 | 897 | 610 | 629 | 680 | 750 | 734 |
| 25 to 39 years | 6384 | 5729 | 4846 | 3240 | 3183 | 4200 | 4699 | 3259 | 3090 | 3394 | 3555 | 3454 |
| 40 to 54 years | 4508 | 4153 | 3604 | 2328 | 2395 | 3305 | 4123 | 3206 | 2944 | 3165 | 3393 | 3573 |
| 55 years and more | 2299 | 2335 | 2182 | 1350 | 1253 | 1577 | 1963 | 1456 | 1273 | 1111 | 1118 | 1284 |
Other regions
- Basic data on Slovak regions
- Labour market indicators of slovak regions.
- Region Bratislava and surroundings
- Region Kopanice
- Region Danube river
- Region lower Vah river
- Region middle Vár river
- Region upper Nitra river
- Region lower Nitra river
- Region Mining cities
- Region Kysuce a Orava
- Region upper Vah river – Liptov
- Region Spiš cities
- Region upper Hron river
- Region Juhoslovenská kotlina
- Region Košice fold and Torysa river
- Region upper Zemplín
- Region lower Zemplín
Suggested citation: Michal Páleník: Regions of Slovakia - Bratislava, IZ Bratislava, retrieved from: https://www.iz.sk/en/projects/regions-of-slovakia/bratislava/city
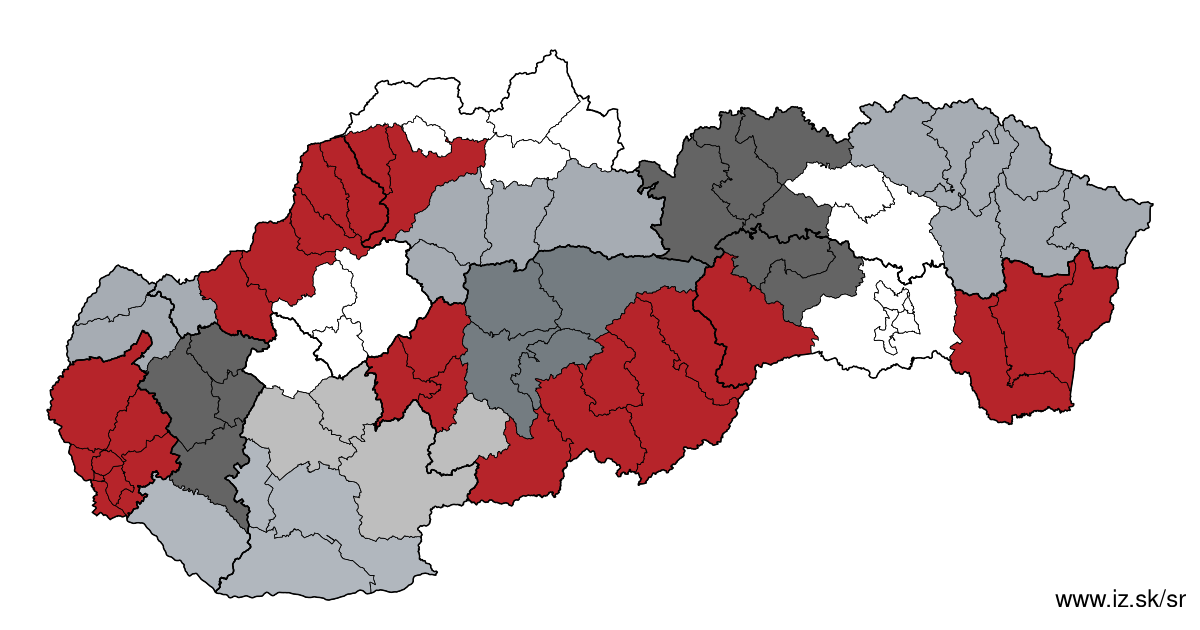
Regions of the Slovak Republic
Due to the need of analysis we have created regions of Slovakia. We will bring more information about these regions from the macroeconomic point of view as well as from the point of view of the labour market.. . .
 Share
Share Facebook
 Twitter
 News
News