IZ Bratislava : Regularly updated : Least developed regions : Development in least developed regions :
Development in least developed regions
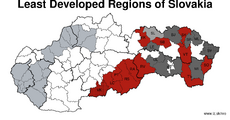
NRO12 defines the original 12 least developed regions as defined in 2015, namely Lučenec, Poltár, Revúca, Rimavská Sobota, Veľký Krtíš, Kežmarok, Sabinov, Svidník, Vranov nad Topľou, Rožňava, Sobrance and Trebišov.
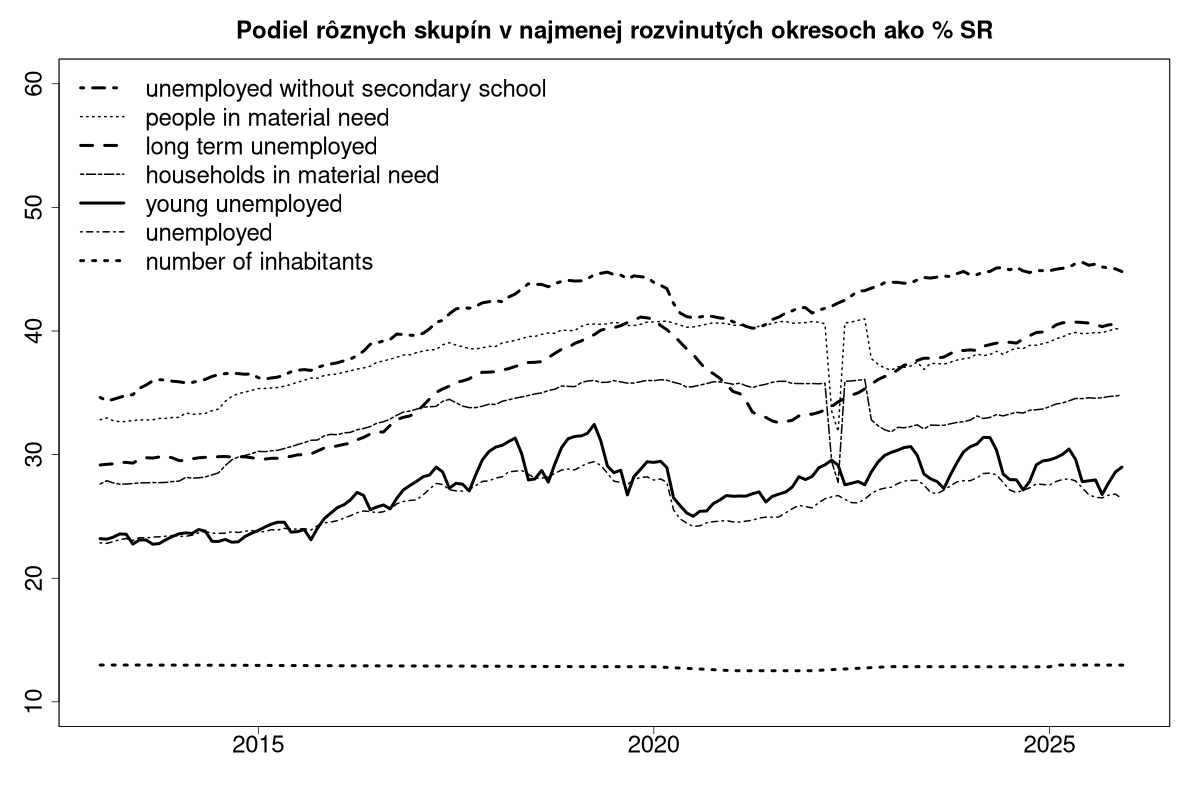
One of the statistics to describe changes in regional differences is to measure share of the least developed regions on Slovakia as total. For example, 13 % of population of Slovakia lives in these 12 least developed regions, however over 27 % of the unemployed lived there. In 2013, the weight was only 23 %.
Below tables illustrate various indicators and their weight on Slovakia.
Share of NRO12 of Slovakia – unemployed
| year / NRO12 | 2013 | 2014 | 2015 | 2016 | 2017 | 2018 | 2019 | 2020 | 2021 | 2022 | 2023 | 2024 | 2025 | 2026 |
|---|---|---|---|---|---|---|---|---|---|---|---|---|---|---|
| number of inhabitants | 13 | 13 | 13 | 12.9 | 12.9 | 12.9 | 12.9 | 12.8 | 12.5 | 12.5 | 12.9 | 12.8 | 12.8 | |
| number of unemployed | 23.2 | 23.7 | 24 | 25.5 | 27.3 | 28.4 | 28.5 | 25.4 | 25.1 | 26.5 | 27.5 | 27.7 | 27.2 | 26.8 |
| unemployed for longer than 4 years | 40.7 | 40.5 | 39.7 | 40.2 | 42.1 | 43.9 | 46.2 | 46.8 | 46.2 | 46.3 | 46.5 | 46.4 | 47.9 | 48.8 |
| number of long-term unemployed | 29.5 | 29.7 | 30 | 31.8 | 35.5 | 37.6 | 40.2 | 38.3 | 33.4 | 34.7 | 37.7 | 39.1 | 40.5 | 40.2 |
| less than 24 years | 23.2 | 23.4 | 24.2 | 26.3 | 28.3 | 29.8 | 29.8 | 26.7 | 27 | 28.6 | 29.3 | 29.4 | 28.8 | 29.3 |
| 55 years and more | 21.3 | 21.8 | 22.2 | 23.6 | 25.8 | 27.4 | 27.8 | 24.8 | 24.1 | 25.5 | 26.6 | 27.5 | 27.1 | 25.9 |
| unemployment outflow | 14.9 | 15.2 | 16.3 | 16.6 | 18.2 | 18.5 | 18.5 | 17.3 | 16.6 | 17 | 16.7 | 16.5 | 15.7 | 14.8 |
| without elementary school | 47 | 49.7 | 49.9 | 50.4 | 50.6 | 51.6 | 52.7 | 52.4 | 51.7 | 52.6 | 54.5 | 55.8 | 57.2 | 57.6 |
| without secondary school | 35.2 | 36.3 | 36.7 | 38.7 | 41.2 | 43.4 | 44.4 | 41.9 | 41 | 42.7 | 44.3 | 44.9 | 45.2 | 44.6 |
| vysoka skola | 11.2 | 11 | 10.9 | 11.5 | 11.3 | 10.8 | 10.6 | 10.1 | 9.9 | 10.2 | 10.2 | 9.7 | 9.5 | 9.5 |
| unemployed in material need | 30.3 | 33.7 | 35.9 | 38.5 | 41.2 | 43.7 | 46.1 | 45.5 | 44.8 | 45.2 | 46.8 | 48.1 | 48.7 | 48.4 |
Labour market policy
| year / NRO12 | 2013 | 2014 | 2015 | 2016 | 2017 | 2018 | 2019 | 2020 | 2021 | 2022 | 2023 | 2024 | 2025 | 2026 |
|---|---|---|---|---|---|---|---|---|---|---|---|---|---|---|
| number of inhabitants | 13 | 13 | 13 | 12.9 | 12.9 | 12.9 | 12.9 | 12.8 | 12.5 | 12.5 | 12.9 | 12.8 | 12.8 | |
| number of unemployed | 23.2 | 23.7 | 24 | 25.5 | 27.3 | 28.4 | 28.5 | 25.4 | 25.1 | 26.5 | 27.5 | 27.7 | 27.2 | 26.8 |
| unemployed in LLL | 5.4 | 15.2 | 21 | 19.5 | 24.4 | 29.6 | 33.7 | 30 | 22.3 | 20.3 | 21.3 | 18.3 | 19 | 23 |
| number of activational workers | 54.9 | 52.1 | 52.4 | 53.1 | 52.5 | 54.3 | 56.5 | 57.2 | 56 | 57.2 | 63 | 58.2 | 57.5 | 57.9 |
| unemployed on graduate praxis | 24 | 20.2 | 19 | 16.5 | 20.5 | 21.8 | 21 | 18.8 | 16.8 | 25.1 | 30.2 | 44.1 | 31.1 | 31.9 |
| LTU bonus | 27.4 | 26.1 | 32.5 | 36.4 | 40.5 | 42.8 | 42.9 | 47.1 | 43.5 | 41.4 | 39.7 | 38.8 | 48.5 | |
| activation bonus | 29.4 | 37.4 | 43.8 | 49.7 | 52.9 | 55.2 | 54.9 | 53.2 | 52.8 | 59.2 | 70 | |||
| number of social enterprises | 26.8 | 18 | 13.4 | 14.1 | 14.4 | 14 | 13 | 12.7 |
Váha NRO12 na Slovensku
| year / NRO12 | 2013 | 2014 | 2015 | 2016 | 2017 | 2018 | 2019 | 2020 | 2021 | 2022 | 2023 | 2024 | 2025 | 2026 |
|---|---|---|---|---|---|---|---|---|---|---|---|---|---|---|
| number of inhabitants | 13 | 13 | 13 | 12.9 | 12.9 | 12.9 | 12.9 | 12.8 | 12.5 | 12.5 | 12.9 | 12.8 | 12.8 | |
| number of unemployed | 23.2 | 23.7 | 24 | 25.5 | 27.3 | 28.4 | 28.5 | 25.4 | 25.1 | 26.5 | 27.5 | 27.7 | 27.2 | 26.8 |
| in economically active age | 12.6 | 12.7 | 12.7 | 12.7 | 12.7 | 12.7 | 12.7 | 12.7 | 12.3 | 12.4 | 12.9 | 13 | 13 | |
| employed, as reported by labour office | 10.6 | 10.5 | 10.6 | 10.6 | 10.7 | 11 | 11 | 10.9 | 10.8 | 10.7 | ||||
| unemployed on sick leave | 19.5 | 19.4 | 19.9 | 20.6 | 20.8 | 21.7 | 22.7 | 22.1 | 21.3 | 20.6 | 22.2 | 25 | 24.7 | 24.9 |
| non-disponible unemployed | 25.3 | 27.2 | 27.8 | 28.9 | 26.4 | 26.8 | 28.6 | 26.7 | 25.9 | 24.8 | 35.6 | 41.2 | 41 | 40 |
| people in material need | 32.8 | 34 | 35.8 | 37.3 | 38.6 | 39.5 | 40.5 | 40.6 | 40.5 | 38.6 | 37.3 | 38.4 | 39.8 | 40.3 |
| domácnosti v HN | 27.7 | 28.8 | 30.8 | 32.5 | 34 | 34.9 | 35.9 | 35.8 | 35.7 | 33.8 | 32.3 | 33.3 | 34.5 | 35 |
| parental benefit | 12.7 | 12.7 | 12.7 | 12.6 | 12.5 | 12.4 | 12.3 | 12.2 | 12.1 | 12.1 | 12 | 11.9 | 11.9 | 11.8 |
| young child benefit | 14.7 | 14.6 | 14.6 | 14.6 | 14.5 | 14.5 | 14.4 | 14.2 | 14.6 | 14.3 | 14.5 | 14.7 | 15.2 | 15.7 |
Share of NRO12 of Slovakia
https://www.iz.sk/en/project/least-developed-region/changes

Regularly updated
On our webpage, we have several data which are regularly updated. These include data on unemployment or legislation.. . .
 Share
Share Facebook
 Twitter
 News
News