| Order | Code | Region | Value | Note |
|---|
| 1. | NUTS2 Region Prague | CZ01 | 2,1 | period 2024 |
| 2. | Utrecht | NL31 | 3,2 | period 2018 |
| 3. | Budapest | HU11 | 3,3 |
| 4. | Central Bohemia cohesion region | CZ02 | 3,4 |
| 5. | Oslo og Akershus | NO01 | 3,4 | period 2015 |
| 6. | North Holland | NL32 | 3,5 |
| 7. | Warszawski stołeczny | PL91 | 3,7 | period 2024 |
| 8. | North Brabant | NL41 | 3,7 |
| 9. | Lower Franconia | DE26 | 3,7 | period 2019 |
| 10. | South Sweden | SE22 | 3,8 |
| 11. | Jihozápad | CZ03 | 3,8 |
| 12. | Vestlandet | NO05 | 3,8 | period 2015 |
| 13. | Groningen | NL11 | 3,9 |
| 14. | Dresden Directorate District | DED2 | 4,1 | period 2019 |
| 15. | Iceland | IS00 | 4,1 |
| 16. | Jihovýchod | CZ06 | 4,1 |
| 17. | Gelderland | NL22 | 4,1 |
| 18. | Giessen Government Region | DE72 | 4,2 | period 2019 |
| 19. | Småland and the islands | SE21 | 4,2 |
| 20. | Central Moravia | CZ07 | 4,2 |
| 21. | Limburg | NL42 | 4,2 |
| 22. | Overijssel | NL21 | 4,3 |
| 23. | Drenthe | NL13 | 4,3 |
| 24. | South Tyrol | ITH1 | 4,4 |
| 25. | West Flanders | BE25 | 4,5 |
| 26. | Vertonne | BG41 | 4,6 |
| 27. | Zeeland | NL34 | 4,6 | period 2024 |
| 28. | Upper Palatinate | DE23 | 4,7 | period 2016 |
| 29. | Basque Autonomous Community | ES21 | 4,7 |
| 30. | West Sweden | SE23 | 4,8 |
| 31. | Flevoland | NL23 | 4,9 |
| 32. | South Holland | NL33 | 4,9 | period 2018 |
| 33. | Stockholm | SE11 | 5 |
| 34. | Upper Bavaria | DE21 | 5 |
| 35. | Western Slovakia | SK02 | 5 |
|---|
| 36. | Lower Bavaria | DE22 | 5 | period 2016 |
| 37. | Severovýchod | CZ05 | 5,2 |
| 38. | Upper Franconia | DE24 | 5,3 | period 2018 |
| 39. | Friesland | NL12 | 5,4 |
| 40. | Silesian Voivodeship | PL22 | 5,4 |
| 41. | Western Slovenia | SI04 | 5,4 |
| 42. | Leipzig Government Region | DED5 | 5,5 | period 2018 |
| 43. | Western Transdanubia | HU22 | 5,5 |
| 44. | Limburg | BE22 | 5,5 |
| 45. | Saarland | DEC0 | 5,6 | period 2019 |
| 46. | Southern Region | IE05 | 5,6 |
| 47. | Province of Antwerp | BE21 | 5,6 |
| 48. | Upper Norrland | SE33 | 5,7 |
| 49. | East Middle Sweden | SE12 | 5,8 |
| 50. | Trentino-South Tyrol | ITH2 | 5,8 |
| 51. | North Yorkshire | UKE2 | 5,8 | period 2019 |
| 52. | Central Slovakia | SK03 | 5,9 |
|---|
| 53. | Agder og Rogaland | NO04 | 5,9 | period 2015 |
| 54. | Umbria | ITI2 | 5,9 |
| 55. | Sør-Østlandet | NO03 | 6 | period 2015 |
| 56. | Lower Silesian Voivodeship | PL51 | 6 |
| 57. | Capital Region of Denmark | DK01 | 6 |
| 58. | North Middle Sweden | SE31 | 6 |
| 59. | Flemish Brabant | BE24 | 6,1 |
| 60. | East Flanders | BE23 | 6,2 |
| 61. | Tübingen Government Region | DE14 | 6,3 | period 2024 |
| 62. | Kassel Government Region | DE73 | 6,3 | period 2019 |
| 63. | Lombardy | ITC4 | 6,3 |
| 64. | Cantabria | ES13 | 6,3 |
| 65. | Hampshire and Isle of Wight | UKJ3 | 6,3 | period 2019 |
| 66. | Eastern Switzerland | CH05 | 6,4 |
| 67. | Norte Region | PT11 | 6,4 |
| 68. | Emilia-Romagna | ITH5 | 6,5 |
| 69. | Innlandet | NO02 | 6,5 | period 2016 |
| 70. | Detmold Government Region | DEA4 | 6,5 |
| 71. | Friuli Venezia Giulia | ITH4 | 6,6 |
| 72. | Luxembourg | BE34 | 6,7 |
| 73. | Northern & Western Region | IE04 | 6,7 |
| 74. | Swabia | DE27 | 6,7 | period 2021 |
| 75. | Middle Franconia | DE25 | 6,8 | period 2022 |
| 76. | Nord-Norge | NO07 | 6,8 | period 2016 |
| 77. | Walloon Brabant | BE31 | 6,9 |
| 78. | Veneto | ITH3 | 6,9 |
| 79. | Eastern & Midland Region | IE06 | 6,9 |
| 80. | Masovian Regional | PL92 | 6,9 |
| 81. | Middle Norrland | SE32 | 6,9 | period 2018 |
| 82. | Tyrol | AT33 | 6,9 |
| 83. | Moravian-Silesian Region | CZ08 | 7 |
| 84. | Centro region | PT16 | 7,1 | period 2018 |
| 85. | Crete Region | EL43 | 7,1 |
| 86. | Salzburg | AT32 | 7,1 |
| 87. | Central Switzerland | CH06 | 7,2 |
| 88. | West Pomeranian Voivodeship | PL42 | 7,3 |
| 89. | Vertonne | FRF1 | 7,4 |
| 90. | Karlsruhe Government Region | DE12 | 7,4 |
| 91. | Cumbria | UKD1 | 7,4 | period 2018 |
| 92. | Carinthia | AT21 | 7,5 |
| 93. | Aττική | EL30 | 7,5 |
| 94. | Canton of Zürich | CH04 | 7,6 |
| 95. | Łódź Voivodeship | PL71 | 7,7 |
| 96. | Central Greece Region | EL64 | 7,7 |
| 97. | North Jutland Region | DK05 | 7,7 |
| 98. | Freiburg Government Region | DE13 | 7,7 |
| 99. | Trier Government Region | DEB2 | 7,8 | period 2006 |
| 100. | Kuyavian-Pomeranian Voivodeship | PL61 | 7,8 |
| 101. | Berkshire, Buckinghamshire and Oxfordshire | UKJ1 | 7,8 | period 2019 |
| 102. | Midi-Pyrénées | FRJ2 | 7,8 |
| 103. | Darmstadt Government Region | DE71 | 7,8 |
| 104. | Warmian-Masurian Voivodeship | PL62 | 7,8 |
| 105. | Lüneburg Government Region | DE93 | 7,8 | period 2024 |
| 106. | Hamburg | DE60 | 7,8 |
| 107. | Gloucestershire, Wiltshire and Bristol/Bath area | UKK1 | 7,9 | period 2019 |
| 108. | Balearic Islands | ES53 | 7,9 |
| 109. | Bratislava Region | SK01 | 7,9 | period 2017 |
|---|
| 110. | Lisbon Region | PT17 | 7,9 | period 2018 |
| 111. | Luxembourg | LU00 | 7,9 |
| 112. | Lesser Poland Voivodeship | PL21 | 8 |
| 113. | Lower Austria | AT12 | 8,1 |
| 114. | Capital Region | LT01 | 8,1 |
| 115. | Greater Poland Voivodeship | PL41 | 8,1 |
| 116. | Brittany | FRH0 | 8,1 |
| 117. | East Wales | UKL2 | 8,1 | period 2019 |
| 118. | Münster Government Region | DEA3 | 8,1 |
| 119. | Tuscany | ITI1 | 8,2 |
| 120. | Opole Voivodeship | PL52 | 8,3 | period 2019 |
| 121. | Eastern Slovenia | SI03 | 8,3 |
| 122. | Trøndelag | NO06 | 8,3 | period 2022 |
| 123. | Stuttgart Government Region | DE11 | 8,3 |
| 124. | Navarre | ES22 | 8,3 |
| 125. | Cologne Government Region | DEA2 | 8,3 |
| 126. | Central Transdanubia | HU21 | 8,3 |
| 127. | Espace Mittelland | CH02 | 8,4 |
| 128. | Region Zealand | DK02 | 8,4 |
| 129. | Malta | MT00 | 8,4 |
| 130. | Rhône-Alpes | FRK2 | 8,4 |
| 131. | Pest County | HU12 | 8,4 |
| 132. | Brunswick Government Region | DE91 | 8,4 |
| 133. | La Rioja | ES23 | 8,4 |
| 134. | Molise | ITF2 | 8,5 |
| 135. | Uusimaa | FI1B | 8,5 |
| 136. | Outer London – West and North West | UKI7 | 8,5 | period 2019 |
| 137. | Piedmont | ITC1 | 8,5 |
| 138. | Surrey, East and West Sussex | UKJ2 | 8,5 | period 2019 |
| 139. | Northwestern Switzerland | CH03 | 8,5 |
| 140. | Weser-Ems Government Region | DE94 | 8,6 |
| 141. | West Central Scotland | UKM8 | 8,6 | period 2019 |
| 142. | Pomeranian Voivodeship | PL63 | 8,6 |
| 143. | Community of Madrid | ES30 | 8,6 |
| 144. | Essex | UKH3 | 8,6 | period 2019 |
| 145. | Burgundy | FRC1 | 8,7 |
| 146. | Kent | UKJ4 | 8,7 | period 2019 |
| 147. | Castile and León | ES41 | 8,7 |
| 148. | Devon | UKK4 | 8,7 | period 2019 |
| 149. | Lublin Voivodeship | PL81 | 8,7 |
| 150. | Aragon | ES24 | 8,8 |
| 151. | Länsi-Suomi | FI19 | 8,8 |
| 152. | Saxony-Anhalt | DEE0 | 8,8 |
| 153. | Koblenz Government Region | DEB1 | 8,8 |
| 154. | Catalonia | ES51 | 8,8 |
| 155. | Mecklenburg-Vorpommern | DE80 | 8,8 | period 2024 |
| 156. | Algarve | PT15 | 8,9 |
| 157. | Marche | ITI3 | 9 |
| 158. | Auvergne | FRK1 | 9,1 |
| 159. | Central Denmark | DK04 | 9,1 |
| 160. | Vest | RO42 | 9,1 |
| 161. | Latvia | LV00 | 9,1 |
| 162. | Rheinhessen-Pfalz | DEB3 | 9,2 |
| 163. | Eastern Scotland | UKM7 | 9,2 | period 2019 |
| 164. | Hainaut | BE32 | 9,2 |
| 165. | Adriatic Croatia | HR03 | 9,2 |
| 166. | Thessaly Region | EL61 | 9,2 |
| 167. | Bedfordshire and Hertfordshire | UKH2 | 9,2 | period 2019 |
| 168. | Cornwall | UKK3 | 9,2 | period 2018 |
| 169. | Southern Denmark | DK03 | 9,3 |
| 170. | Bremen | DE50 | 9,3 | period 2019 |
| 171. | Vorarlberg | AT34 | 9,3 |
| 172. | Upper Austria | AT31 | 9,4 |
| 173. | Schleswig-Holstein | DEF0 | 9,4 |
| 174. | Cyprus | CY00 | 9,4 |
| 175. | South Aegean Region | EL42 | 9,4 |
| 176. | Lazio | ITI4 | 9,5 |
| 177. | Düsseldorf Government Region | DEA1 | 9,5 |
| 178. | Lincolnshire | UKF3 | 9,5 | period 2019 |
| 179. | Brussels-Capital Region | BE10 | 9,5 |
| 180. | Chemnitz Government Region | DED4 | 9,6 |
| 181. | București-Ilfov | RO32 | 9,6 |
| 182. | Galicia | ES11 | 9,6 |
| 183. | Leicestershire, Rutland and Northamptonshire | UKF2 | 9,7 | period 2019 |
| 184. | Dorset and Somerset | UKK2 | 9,7 | period 2019 |
| 185. | Northern Ireland | UKN0 | 9,7 | period 2019 |
| 186. | Alentejo region | PT18 | 9,8 | period 2018 |
| 187. | Asturias | ES12 | 9,8 |
| 188. | Podlaskie Voivodeship | PL84 | 9,8 | period 2021 |
| 189. | Hanover Government Region | DE92 | 9,9 |
| 190. | Central Macedonia Region | EL52 | 9,9 |
| 191. | Southern Finland | FI1C | 9,9 |
| 192. | Southern Great Plain | HU33 | 9,9 |
| 193. | West Greece Region | EL63 | 10 |
| 194. | Province of Namur | BE35 | 10 |
| 195. | Inner London – West | UKI3 | 10,1 | period 2019 |
| 196. | Pays de la Loire | FRG0 | 10,1 |
| 197. | Extremadura | ES43 | 10,1 |
| 198. | Thuringia | DEG0 | 10,2 |
| 199. | Region of Murcia | ES62 | 10,3 |
| 200. | Castilla–La Mancha | ES42 | 10,3 |
| 201. | Liguria | ITC3 | 10,3 |
| 202. | Brandenburg | DE40 | 10,4 |
| 203. | Île-de-France | FR10 | 10,4 |
| 204. | Herefordshire, Worcestershire and Warwickshire | UKG1 | 10,4 | period 2019 |
| 205. | City of Belgrade | RS11 | 10,5 |
| 206. | Valencian Community | ES52 | 10,5 |
| 207. | Ceuta | ES63 | 10,5 |
| 208. | Pohjois- ja Itä-Suomi | FI1D | 10,5 |
| 209. | Andalusia | ES61 | 10,6 |
| 210. | Styria | AT22 | 10,6 |
| 211. | Centre-Val de Loire | FRB0 | 10,6 |
| 212. | Eastern Macedonia and Thrace Region | EL51 | 10,6 |
| 213. | Derbyshire and Nottinghamshire | UKF1 | 10,7 | period 2019 |
| 214. | Canton of Ticino | CH07 | 10,8 |
| 215. | Severoiztochen Planning Region | BG33 | 10,8 |
| 216. | Świętokrzyskie Voivodeship | PL72 | 10,8 | period 2021 |
| 217. | Arnsberg Government Region | DEA5 | 10,9 |
| 218. | Estonia | EE00 | 10,9 |
| 219. | Severozápad | CZ04 | 11 |
| 220. | Abruzzo | ITF1 | 11 |
| 221. | East Yorkshire and Northern Lincolnshire | UKE1 | 11 | period 2019 |
| 222. | Basilicata | ITF5 | 11 |
| 223. | Nord-Est | RO21 | 11,1 |
| 224. | Lake Geneva region | CH01 | 11,1 |
| 225. | Sardinia | ITG2 | 11,2 |
| 226. | Shropshire and Staffordshire | UKG2 | 11,3 | period 2019 |
| 227. | Aquitaine | FRI1 | 11,3 |
| 228. | Provence-Alpes-Côte d'Azur | FRL0 | 11,4 |
| 229. | Subcarpathian Voivodeship | PL82 | 11,4 |
| 230. | Poitou-Charentes | FRI3 | 11,4 |
| 231. | Limousin | FRI2 | 11,5 | period 2024 |
| 232. | Outer London – East and North East | UKI5 | 11,6 | period 2019 |
| 233. | Northumberland and Tyne and Wear | UKC2 | 11,6 | period 2019 |
| 234. | Inner London – East | UKI4 | 11,6 | period 2019 |
| 235. | Peloponnese Region | EL65 | 11,6 |
| 236. | Province of Liege | BE33 | 11,6 |
| 237. | East Anglia | UKH1 | 11,6 | period 2019 |
| 238. | West Midlands | UKG3 | 11,7 | period 2019 |
| 239. | Nord-Pas-de-Calais | FRE1 | 11,8 |
| 240. | Šumadija and Western Serbia | RS21 | 11,9 |
| 241. | Greater Manchester | UKD3 | 11,9 | period 2019 |
| 242. | Açores (NUTS 2) | PT20 | 11,9 |
| 243. | Calabria | ITF6 | 12 |
| 244. | North Eastern Scotland | UKM5 | 12 | period 2018 |
| 245. | Madeira (NUTS 2) | PT30 | 12,2 | period 2021 |
| 246. | Melilla | ES64 | 12,2 |
| 247. | Berlin | DE30 | 12,3 |
| 248. | Canarias | ES70 | 12,4 |
| 249. | Lorraine | FRF3 | 12,5 |
| 250. | Languedoc-Roussillon | FRJ1 | 12,7 |
| 251. | Wien | AT13 | 12,8 |
| 252. | Northern Great Plain | HU32 | 12,9 |
| 253. | Nord-Vest | RO11 | 12,9 |
| 254. | Franche-Comté | FRC2 | 13 |
| 255. | Picardy | FRE2 | 13,1 |
| 256. | Merseyside | UKD7 | 13,2 | period 2019 |
| 257. | Southern Scotland | UKM9 | 13,3 | period 2019 |
| 258. | Highlands and Islands | UKM6 | 13,4 | period 2014 |
| 259. | Southern Transdanubia | HU23 | 13,4 |
| 260. | Outer London – South | UKI6 | 13,4 | period 2019 |
| 261. | Cheshire | UKD6 | 13,6 | period 2019 |
| 262. | Lancashire | UKD4 | 13,7 | period 2019 |
| 263. | Eastern Slovakia | SK04 | 13,7 |
|---|
| 264. | Yugozapaden Planning Region | BG42 | 13,7 |
| 265. | Western Macedonia Region | EL53 | 13,8 |
| 266. | West Wales | UKL1 | 13,9 | period 2019 |
| 267. | Upper Normandy | FRD2 | 13,9 |
| 268. | South Yorkshire | UKE3 | 13,9 | period 2019 |
| 269. | Lower Normandy | FRD1 | 13,9 |
| 270. | Champagne-Ardenne | FRF2 | 13,9 |
| 271. | Apulia | ITF4 | 13,9 |
| 272. | Vojvodina | RS12 | 14,1 |
| 273. | West Yorkshire | UKE4 | 14,8 | period 2019 |
| 274. | Lubusz Voivodeship | PL43 | 14,8 | period 2021 |
| 275. | Central and Western Lithuania region | LT02 | 15 |
| 276. | Aosta Valley | ITC2 | 15,4 | period 2022 |
| 277. | Epirus Region | EL54 | 15,8 |
| 278. | Campania | ITF3 | 16 |
| 279. | Severen Tsentralen Planning Region | BG32 | 16 |
| 280. | Sicily | ITG1 | 16,1 |
| 281. | Southern and Eastern Serbia | RS22 | 16,1 |
| 282. | Antalya Subregion | TR61 | 16,3 |
| 283. | North Aegean Region | EL41 | 16,6 |
| 284. | Istanbul Subregion | TR10 | 16,6 |
| 285. | Ankara Province | TR51 | 17 |
| 286. | Northern Hungary | HU31 | 17 |
| 287. | Tees Valley | UKC1 | 17,3 | period 2019 |
| 288. | Kastamonu Subregion | TR82 | 17,5 |
| 289. | Corsica | FRM0 | 17,7 | period 2024 |
| 290. | Kontinentalna Hrvatska | HR04 | 17,9 | period 2015 |
| 291. | Guadeloupe | FRY1 | 18 |
| 292. | İzmir Subregion | TR31 | 18,8 |
| 293. | Kocaeli Subregion | TR42 | 19,3 |
| 294. | North Macedonia | MK00 | 19,3 |
| 295. | Yugoiztochen Planning Region | BG34 | 19,5 |
| 296. | Trabzon Subregion | TR90 | 19,5 |
| 297. | Ionian Islands Region | EL62 | 19,5 |
| 298. | Balıkesir Subregion | TR22 | 19,8 |
| 299. | Martinique | FRY2 | 20 |
| 300. | Centru | RO12 | 20 |
| 301. | Réunion | FRY4 | 20,1 |
| 302. | Samsun Subregion | TR83 | 20,1 |
| 303. | Aydın Subregion | TR32 | 20,3 |
| 304. | Montenegro | ME00 | 21,1 | period 2020 |
| 305. | Kayseri Subregion | TR72 | 21,5 |
| 306. | Bursa Subregion | TR41 | 21,8 |
| 307. | Severozapaden Planning Region | BG31 | 22,2 |
| 308. | Konya Subregion | TR52 | 22,2 |
| 309. | Sud-Muntenia | RO31 | 22,7 |
| 310. | Tekirdağ Subregion | TR21 | 22,7 |
| 311. | Sud-Vest Oltenia | RO41 | 23,5 |
| 312. | Manisa Subregion | TR33 | 23,7 |
| 313. | Sud-Est | RO22 | 23,7 |
| 314. | Zonguldak Subregion | TR81 | 23,9 |
| 315. | Gaziantep Subregion | TRC1 | 24,4 |
| 316. | French Guiana | FRY3 | 24,4 |
| 317. | Adana Subregion | TR62 | 24,5 |
| 318. | Kırıkkale Subregion | TR71 | 25,2 |
| 319. | Erzurum Subregion | TRA1 | 26,3 |
| 320. | Hatay Subregion | TR63 | 28,9 |
| 321. | Malatya Subregion | TRB1 | 30 |
| 322. | Mardin Subregion | TRC3 | 33,7 |
| 323. | Ağrı Subregion | TRA2 | 36,2 |
| 324. | Şanlıurfa Subregion | TRC2 | 38,2 |
| 325. | Mayotte | FRY5 | 39,5 |
| 326. | Van Subregion | TRB2 | 41,9 |
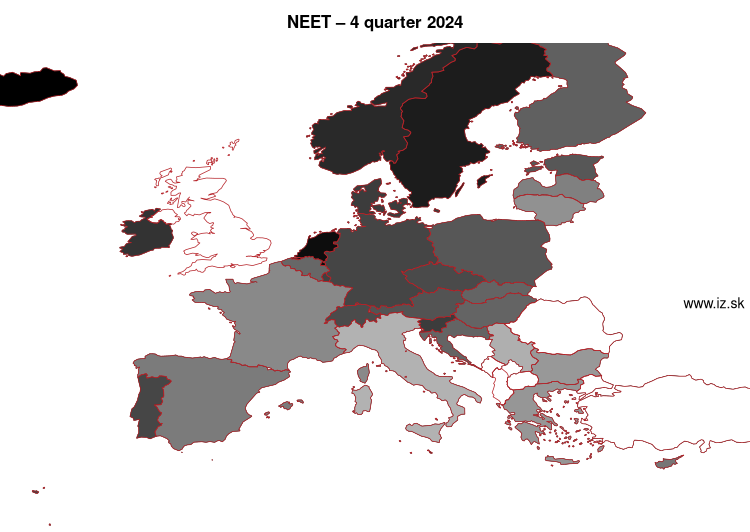
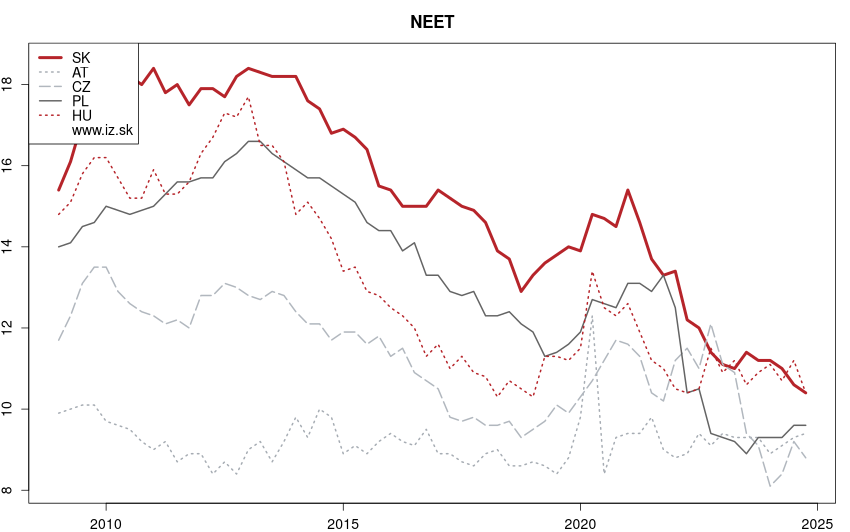
Suggested citation: Michal Páleník: Europe and its regions in numbers - NEET NUTS 2 – year 2025, IZ Bratislava, retrieved from: https://www.iz.sk/en/projects/EU-indicators/young-unemployed-not-taking-part-in-education, ISBN: 978-80-970204-9-1, DOI:10.5281/zenodo.10200164
https://www.iz.sk/en/projects/EU-indicators/young-unemployed-not-taking-part-in-education
 Tento článok je súčasťou projektu Politiky zamestnanosti realizovaného Inštitútom zamestnanosti. Tento projekt je podporený z Európskeho sociálneho fondu v rámci OP EVS.
 Share
Share Facebook
 Twitter
 News
News