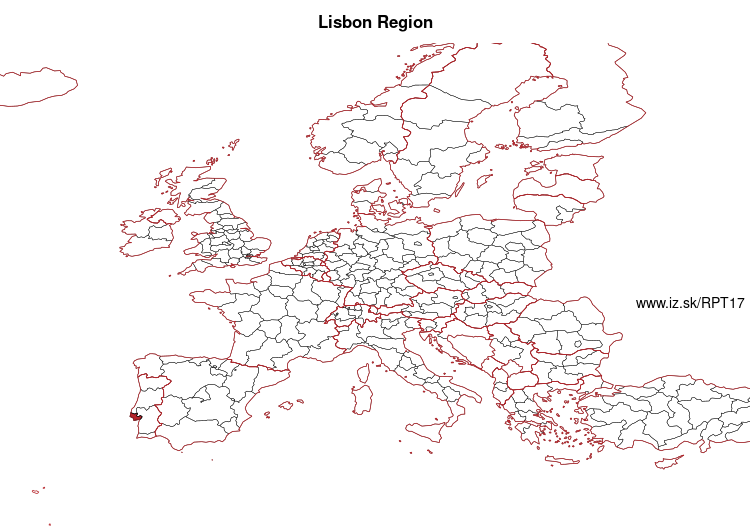
Lisbon Region – PT17
EU regions: Portugal > Continental Portugal > Lisbon Region
| Indicator | Period | Value |
|---|---|---|
| Life long learning | ||
| life long learning participation | 2018 | 12.8 |
| Part time jobs and flexible employment | ||
| percentage of part time workers | 2018 | 8.57 |
| percentage of part time workers, men | 2018 | 6.14 |
| percentage of part time workers, women | 2018 | 10.92 |
| Gender differences | ||
| gender gap in employment rate | 2018 | 95.08 |
| gender gap in unemployment rate | 2018 | 109.86 |
| Graduates and young people | ||
| unemployment rate of youth with elementary education | 2018 | 24.7 |
| NEET | 2018 | 7.9 |
| Employment | ||
| employment rate | 2018 | 71.3 |
| Social exclusion | ||
| people at risk of poverty or social exclusion | 2020 | 14.6 |
Lisbon Region slovensky: PT17
Subregions: Lisbon metropolitan area
Unemployment
| Indicator | Period | Value |
|---|---|---|
| Unemployment | ||
| unemployment rate | 2018 | 7.6 |
| youth unemployment rate | 2018 | 20.4 |
| Long term unemployment | ||
| long term unemployment | 2018 | 3.2 |
| share of long term unemployed | 2018 | 42.6 |
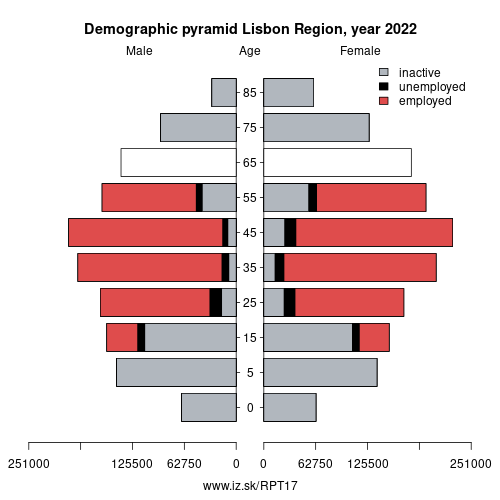
Demographics
| Indicator | Period | Value |
|---|---|---|
| Demographics | ||
| number of inhabitants | 2023 | 2 921 564 |
| population density | 2022 | 1026.6 |
| old-age dependency ratio | 2023 | 34.6 |
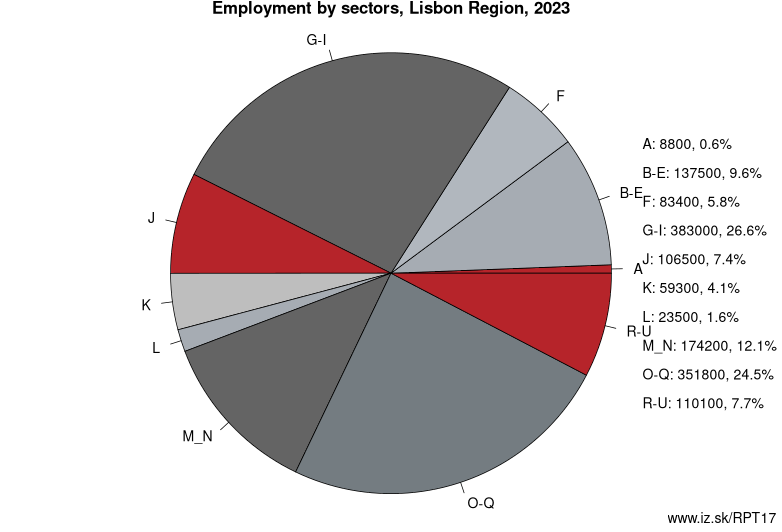
Employment by sectors, Lisbon Region
| NACE r2 | % | NACE r2 | % | ||
|---|---|---|---|---|---|
| A | 12.1 | 1% | B-E | 134.3 | 10% |
| F | 69.2 | 5% | G-I | 368.3 | 27% |
| J | 65.8 | 5% | K | 64.5 | 5% |
| L | 18.6 | 1% | M_N | 156.7 | 12% |
| O-Q | 353.7 | 26% | R-U | 104 | 8% |
| TOTAL | 1347.1 | 100% |
Data for the period year 2018. Source of the data is Eurostat, table [lfst_r_lfe2en2].
Other: Continental Portugal, Lisbon Region, Alentejo region, Algarve, Centro region, Norte Region
Neighbours: Alentejo region, Centro region
Subregions: Lisbon metropolitan area
Suggested citation: Michal Páleník: Europe and its regions in numbers - Lisbon Region – PT17, IZ Bratislava, retrieved from: https://www.iz.sk/PPT17, ISBN: 978-80-970204-9-1, DOI:10.5281/zenodo.10200164
https://www.iz.sk/en/projects/eu-regions/PT17
 Share
Share Facebook
 Twitter
 News
News