Croatia – HR
Croatia slovensky: HR
Subregions: HRVATSKA, Adriatic Croatia, Kontinentalna Hrvatska
Unemployment
| Indicator | Period | Value |
|---|---|---|
| Unemployment | ||
| unemployment rate | 2025 | 4.9 |
| youth unemployment rate | 2025 | 18.3 |
| unemployment rate of low educated people | 2025q4 | 8.1 |
| Long term unemployment | ||
| long term unemployment | 2025q4 | 1.7 |
| share of long term unemployed | 2025 | 36.9 |
Composition of population according to age group, education and economic activity, Croatia
| Age group | Low education | Middle education | High education |
|---|---|---|---|
| Y20-29 | P: 13.0 E: 3.3; U: 2.5; I: 7.2 | P: 299.0 E: 179.3; U: 19.2; I: 100.5 | P: 114.3 E: 76.9; U: 9.2; I: 28.2 |
| Y30-39 | P: 16.8 E: 8.9; U: 1.4; I: 6.5 | P: 265.7 E: 230.8; U: 11.5; I: 23.4 | P: 192.3 E: 181.8; U: 6.1; I: 4.4 |
| Y40-49 | P: 40.6 E: 25.2; U: 2.9; I: 12.5 | P: 321.6 E: 281.6; U: 10.2; I: 29.8 | P: 170.7 E: 164.5; U: 1.6; I: 4.6 |
| Y50-59 | P: 76.0 E: 36.0; U: 3.2; I: 36.8 | P: 326.9 E: 232.6; U: 9.3; I: 85.0 | P: 116.2 E: 104.4; U: 1.8; I: 10.0 |
| Y60-69 | P: 128.9 E: 10.8; U: 0.7; I: 117.4 | P: 318.6 E: 79.9; U: 2.2; I: 236.5 | P: 101.5 E: 43.2; U: 1.0; I: 57.3 |
Note: in thousands in 2024, according to labour force sample survey. P – total population, E – employed, U – unemployed, I – number of economically inactive
Demographics
| Indicator | Period | Value |
|---|---|---|
| Demographics | ||
| number of inhabitants | 2025 | 3 874 350 |
| population density | 2024 | 69.2 |
| old-age dependency ratio | 2025 | 37 |
| Population ageing | ||
| unemployment rate – over 55 years | 2025q4 | 3.7 |
| aggregate replacement ratio | 2025 | 0.37 |
| aggregate replacement ratio – females | 2025 | 0.36 |
| life expectancy of a 50 year old | 2023 | 30.4 |
| healty life expectancy at 50 years | 2023 | 15.3 |
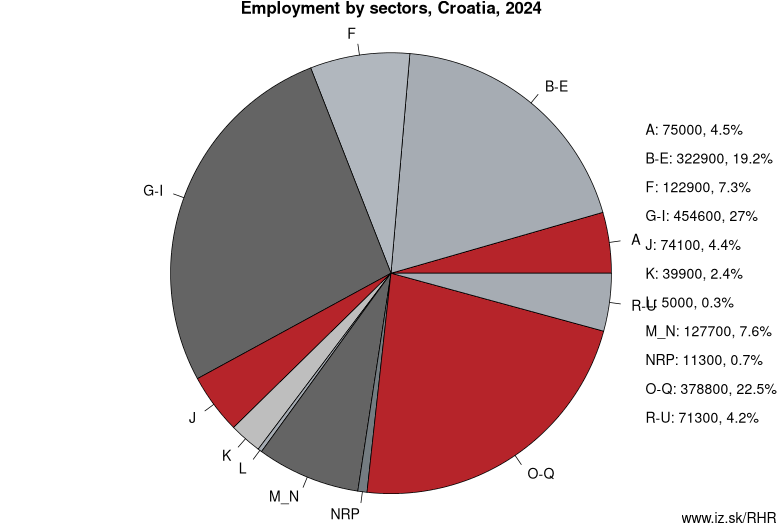
Employment by sectors, Croatia
| NACE r2 | % | NACE r2 | % | ||
|---|---|---|---|---|---|
| A | 74.1 | 4% | B-E | 318.4 | 19% |
| F | 122.3 | 7% | G-I | 456.2 | 27% |
| J | 75.8 | 4% | K | 37.8 | 2% |
| L | 9 | 1% | M_N | 131.8 | 8% |
| NRP | 7.3 | 0% | O-Q | 394.1 | 23% |
| R-U | 75.5 | 4% | TOTAL | 1702.2 | 100% |
Data for the period year 2025. Source of the data is Eurostat, table [lfst_r_lfe2en2].
From Wikipedia :
Croatia ( (listen), kroh-AY-shə; Croatian: Hrvatska, pronounced [xř̩ʋaːtskaː]), officially the Republic of Croatia (Croatian: Republika Hrvatska, listen ), is a country at the crossroads of Central and Southeast Europe, on the Adriatic Sea. It borders Slovenia to the northwest, Hungary to the northeast, Serbia to the east, Bosnia and Herzegovina, and Montenegro to the southeast, sharing a maritime border with Italy. Its capital, Zagreb, forms one of the country's primary subdivisions, along with twenty counties. Croatia has an area of 56,594 square kilometres (21,851 square miles) and a population of 4.28 million, most of whom are Roman Catholics.Inhabited since the Paleolithic Age, the Croats arrived in the area in the 6th century and organised the territory into two duchies by the 9th century. Croatia was first internationally recognized as an independent state on 7 June 879 during the reign of duke Branimir. Tomislav became the first king by 925, elevating Croatia to the status of a kingdom, which retained its sovereignty for nearly two centuries. During the succession crisis after the Trpimirović dynasty ended, Croatia entered a personal union with Hungary in 1102. In 1527, faced with Ottoman conquest, the Croatian Parliament elected Ferdinand I of Austria to the Croatian throne. In October 1918, in the final days of World War I, the State of Slovenes, Croats and Serbs, independent from Austria-Hungary, was proclaimed in Zagreb, and in December 1918 it was merged into the Kingdom of Serbs, Croats and Slovenes.
Neighbours: Slovenia, Montenegro, Serbia, Hungary
Subregions: HRVATSKA, Adriatic Croatia, Kontinentalna Hrvatska
Suggested citation: Michal Páleník: Europe and its regions in numbers - Croatia – HR, IZ Bratislava, retrieved from: https://www.iz.sk/PHR, ISBN: 978-80-970204-9-1, DOI:10.5281/zenodo.10200164
 Share
Share Facebook
 Twitter
 News
News