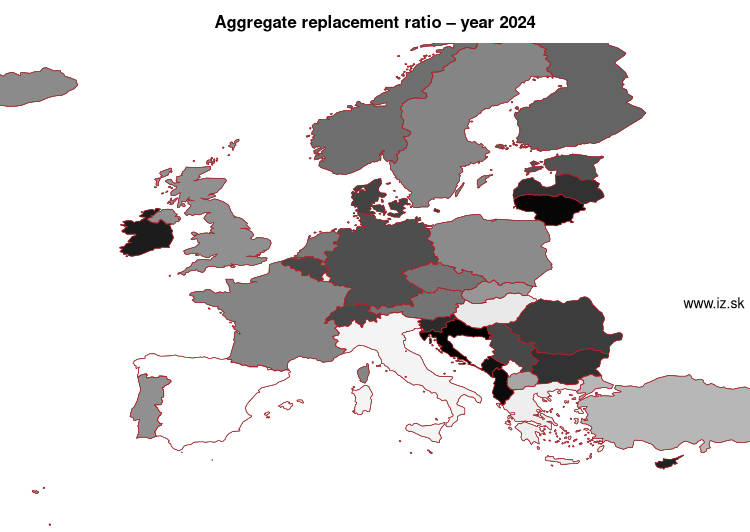
Aggregate replacement ratio – year 2025
| Order | Code | Region | Value | Note |
|---|---|---|---|---|
| 1. | Albania | AL | 0,3 | period 2023 |
| 2. | Lithuania | LT | 0,37 | |
| 3. | Croatia | HR | 0,37 | |
| 4. | Ireland | IE | 0,38 | |
| 5. | Cyprus | CY | 0,41 | |
| 6. | Slovenia | SI | 0,41 | |
| 7. | Latvia | LV | 0,43 | |
| 8. | Serbia | RS | 0,43 | |
| 9. | Montenegro | ME | 0,44 | period 2023 |
| 10. | Denmark | DK | 0,46 | |
| 11. | Bulgaria | BG | 0,46 | |
| 12. | Romania | RO | 0,47 | |
| 13. | Malta | MT | 0,47 | |
| 14. | Belgium | BE | 0,48 | |
| 15. | Germany | DE | 0,48 | |
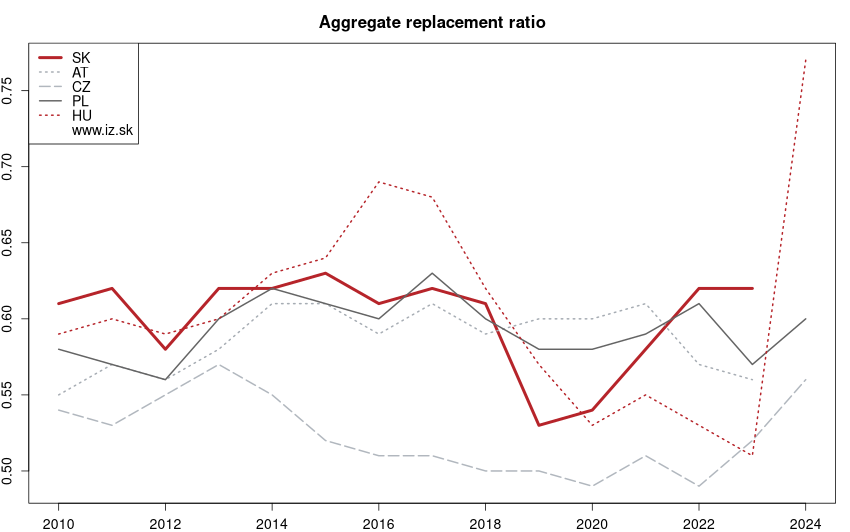
| 16. | Hungary | HU | 0,49 | |
| 17. | Estonia | EE | 0,49 | |
| 18. | Switzerland | CH | 0,5 | period 2024 |
| 19. | North Macedonia | MK | 0,51 | period 2024 |
| 20. | Czech Republic | CZ | 0,53 | |
| 21. | Finland | FI | 0,53 | |
| 22. | Norway | NO | 0,55 | |
| 23. | Austria | AT | 0,56 | |
| 24. | Netherlands | NL | 0,56 | |
| 25. | Sweden | SE | 0,59 | |
| 26. | Poland | PL | 0,6 | |
| 27. | Iceland | IS | 0,6 | period 2020 |
| 28. | United Kingdom | UK | 0,61 | period 2018 |
| 29. | France | FR | 0,61 | |
| 30. | Slovakia | SK | 0,62 | |
| 31. | Turkey | TR | 0,67 | |
| 32. | Portugal | PT | 0,68 | |
| 33. | Greece | EL | 0,77 | |
| 34. | Italy | IT | 0,8 | |
| 35. | Spain | ES | 0,81 | |
| 36. | Luxembourg | LU | 0,88 |
Data for the period year 2025. Source of the data is Eurostat, table [ilc_pnp3].
See also:
Suggested citation: Michal Páleník: Europe and its regions in numbers - Aggregate replacement ratio – year 2025, IZ Bratislava, retrieved from: https://www.iz.sk/en/projects/EU-indicators/aggregate-replacement-ratio, ISBN: 978-80-970204-9-1, DOI:10.5281/zenodo.10200164
 Tento článok je súčasťou projektu Politiky zamestnanosti realizovaného Inštitútom zamestnanosti. Tento projekt je podporený z Európskeho sociálneho fondu v rámci OP EVS.
https://www.iz.sk/en/projects/EU-indicators/aggregate-replacement-ratio
 Share
Share Facebook
 Twitter
 News
News