Iceland – IS
Iceland slovensky: IS
Unemployment
| Indicator | Period | Value |
|---|---|---|
| Unemployment | ||
| unemployment rate | 2024 | 3.7 |
| youth unemployment rate | 2025q2 | 8.3 |
| unemployment rate of low educated people | 2025q2 | 7 |
| Long term unemployment | ||
| long term unemployment | 2024 | 0.4 |
| share of long term unemployed | 2024 | 12.1 |
Composition of population according to age group, education and economic activity, Iceland
| Age group | Low education | Middle education | High education |
|---|---|---|---|
| Y20-29 | P: 13.8 E: 11.1; U: 0.8; I: 1.9 | P: 24.5 E: 20.5; U: 0.9; I: 3.1 | P: 14.8 E: 13.7; U: 0.3; I: 0.8 |
| Y30-39 | P: 7.8 E: 6.5; U: 0.3; I: 1.0 | P: 21.6 E: 19.5; U: 0.5; I: 1.6 | P: 30.9 E: 29.2; U: 0.7; I: 1.0 |
| Y40-49 | P: 8.6 E: 6.9; U: 0.1; I: 1.6 | P: 17.1 E: 15.4; U: 0.1; I: 1.6 | P: 26.4 E: 24.6; U: 0.7; I: 1.1 |
| Y50-59 | P: 8.3 E: 5.8; U: 0.4; I: 2.1 | P: 16.5 E: 14.1; U: 0.2; I: 2.2 | P: 20.7 E: 19.0; U: 0.3; I: 1.4 |
| Y60-69 | P: 9.6 E: 4.7; U: 0.3; I: 4.6 | P: 18.7 E: 12.2; U: 0.2; I: 6.3 | P: 12.3 E: 8.9; U: 0.2; I: 3.2 |
Note: in thousands in 2024, according to labour force sample survey. P – total population, E – employed, U – unemployed, I – number of economically inactive
Demographics
| Indicator | Period | Value |
|---|---|---|
| Demographics | ||
| number of inhabitants | 2025 | 389 444 |
| population density | 2024 | 3.8 |
| old-age dependency ratio | 2025 | 23.9 |
| Population ageing | ||
| unemployment rate – over 55 years | 2024q4 | 3.1 |
| aggregate replacement ratio | 2020 | 0.6 |
| aggregate replacement ratio – females | 2020 | 0.64 |
| life expectancy of a 50 year old | 2023 | 34.2 |
| healty life expectancy at 50 years | 2018 | 22.3 |
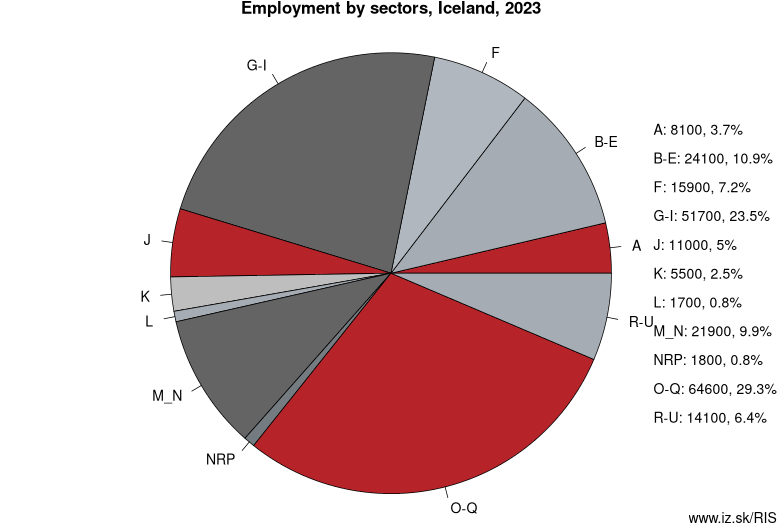
Employment by sectors, Iceland
| NACE r2 | % | NACE r2 | % | ||
|---|---|---|---|---|---|
| A | 8.4 | 4% | B-E | 24.4 | 11% |
| F | 17.6 | 8% | G-I | 53.2 | 23% |
| J | 10.8 | 5% | K | 6.1 | 3% |
| L | 1.7 | 1% | M_N | 21.7 | 9% |
| NRP | 2.3 | 1% | O-Q | 69.1 | 30% |
| R-U | 14.3 | 6% | TOTAL | 229.5 | 100% |
Data for the period year 2024. Source of the data is Eurostat, table [lfst_r_lfe2en2].
Other: Iceland, Italy, Ireland
Suggested citation: Michal Páleník: Europe and its regions in numbers - Iceland – IS, IZ Bratislava, retrieved from: https://www.iz.sk/PIS, ISBN: 978-80-970204-9-1, DOI:10.5281/zenodo.10200164
https://www.iz.sk/en/projects/eu-regions/IS
 Share
Share Facebook
 Twitter
 News
News