30 graphs on ageing
30 graphs on ageing of population, doctors, dentists, pharmacy and nurses in Slovakia.
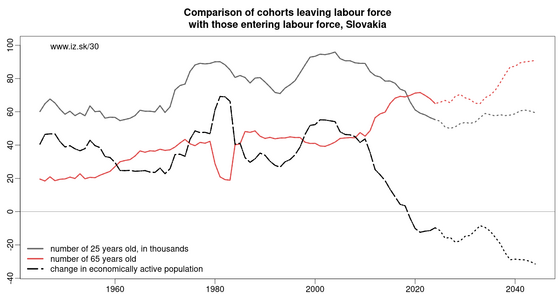
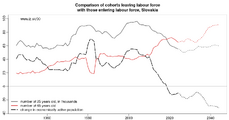
23.04.2026 (link) : Demographic changes in Slovakia – How did the number of people entering the labour force change in comparison to those exiting it? . . .
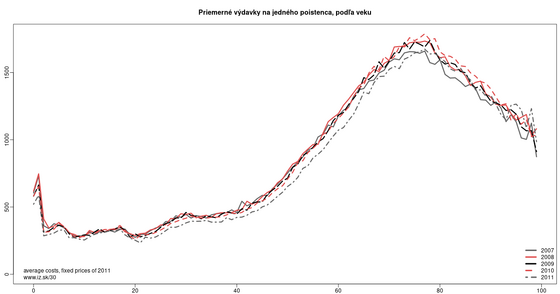
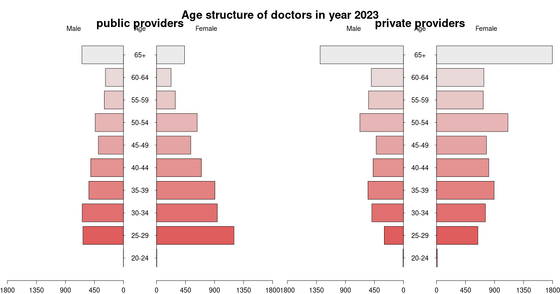
13.03.2026 (link) : Health care expenditures – Inhabitants per physician by Slovak health care companies . . .
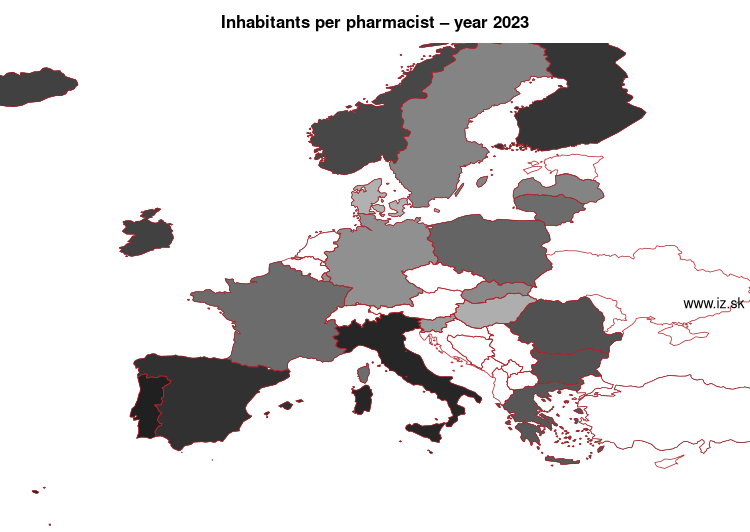
10.03.2026 (link) : Inhabitants per pharmacist – year 2024 – Inhabitants per pharmacist for year 2024 . . .
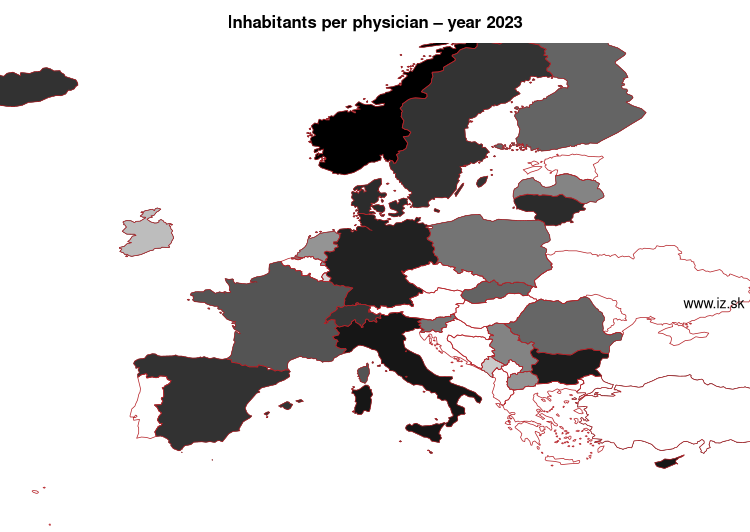
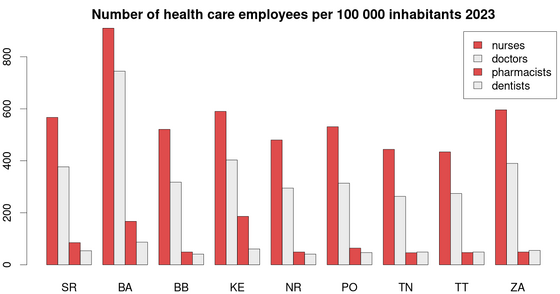
10.03.2026 (link) : Inhabitants per physician – year 2024 – Inhabitants per physician for year 2024 . . .
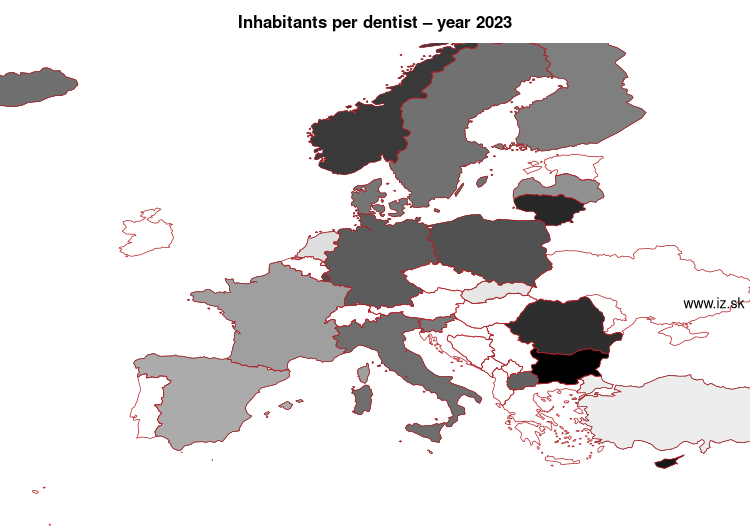
10.03.2025 (link) : Inhabitants per dentist – year 2024 – Inhabitants per dentist for year 2024 . . .
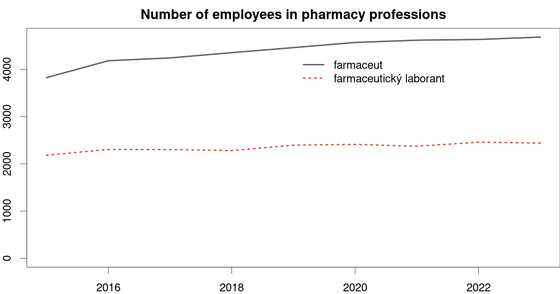
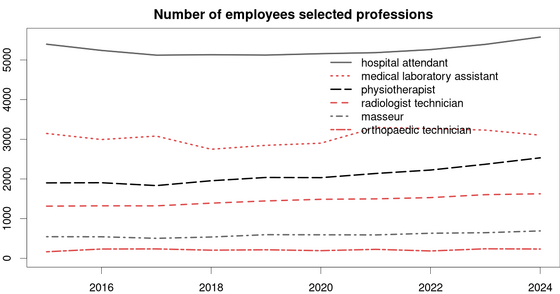
20.12.2022 (link) : Pharmacy professions – Development of workers in pharmacy professions in Slovakia . . .
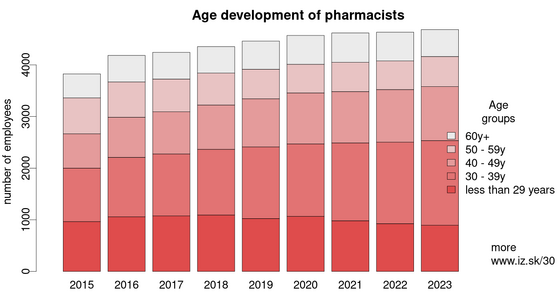
11.11.2022 (link) : Age development of pharmacists – Age development of pharmacists in Slovakia . . .
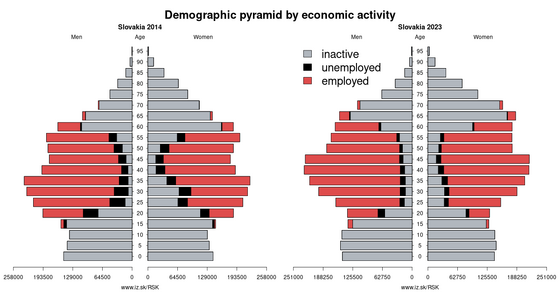
24.01.2022 (link) : Demographic pyramid by economic activity – Demographic pyramid by economic activity describes how many people of each age group is employed, unemployed or inactive . . .
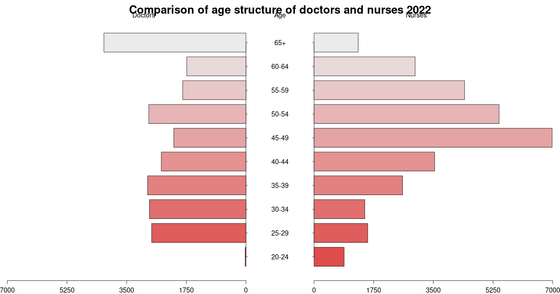
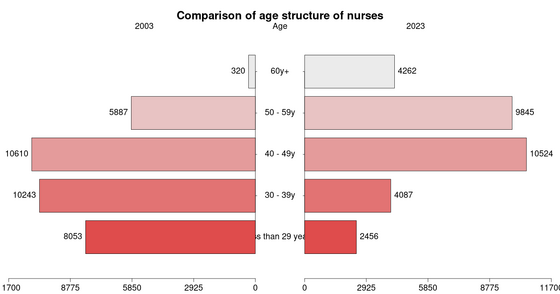
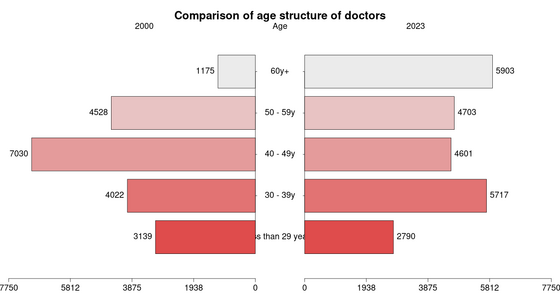
18.11.2021 (link) : Comparison of age structure of nurses and doctors – Comparison of age structure of nurses and doctors in Slovakia . . .
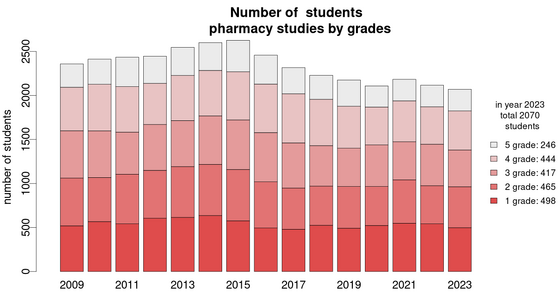
06.10.2021 (link) : Number of pharmacy students – In year 2020, there were around 500 students in one grade of pharmacy studies. This number is decreasing . . .
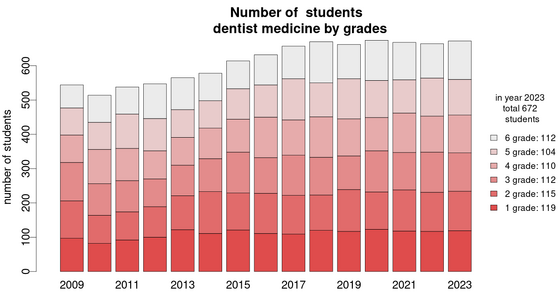
06.10.2021 (link) : Number of dentistry students – Between 2009 and 2017 we saw an increase of dentistry students, from 510 to 650. The number of dentistry students, that are not Slovak citizens, is stable . . .
06.10.2021 (link) : Dentists – How does the structure and age of dentists change? How did the structure of dentistry students change? . . .
06.10.2021 (link) : Pharmacy – How does the structure and age of pharmacists change? How did the structure of pharmacy students change? . . .
04.05.2021 (link) : Doctors – How does the structure and age of doctors change? How did the structure of medicine students change? . . .
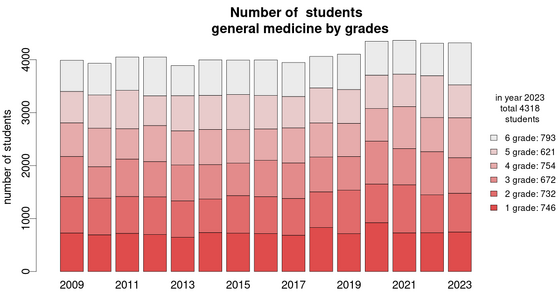
18.02.2021 (link) : Number of medicine students – The number of medicine students, which are from Slovakia, is around 4000 students . . .
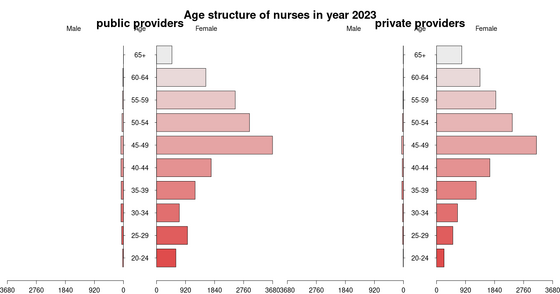
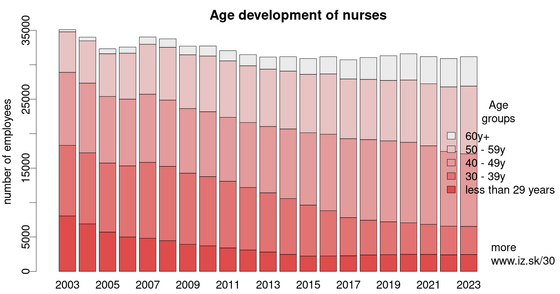
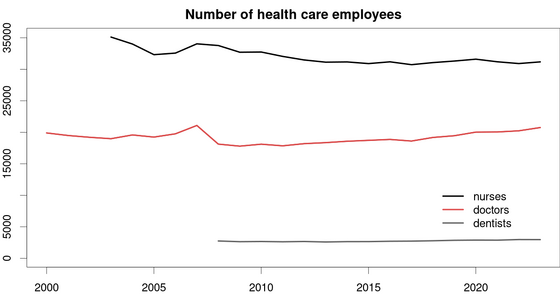
18.02.2021 (link) : Nurses – How does the number and structure of nurses change? . . .
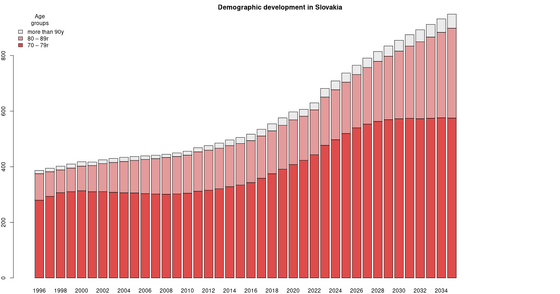
11.02.2021 (link) : Demographic development in Slovakia – Demographic development in Slovakia will result in high number of people in old age groups . . .
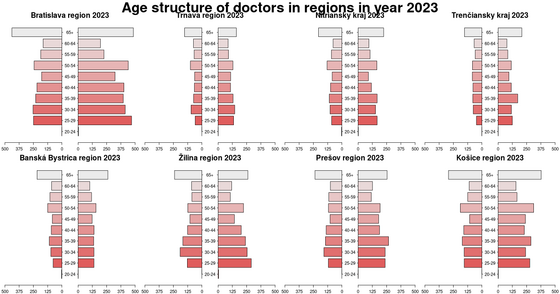
10.02.2021 (link) : Age structure of doctors in regions – The number of doctors in age group of 40 to 60 years is very low in all regions of Slovakia . . .
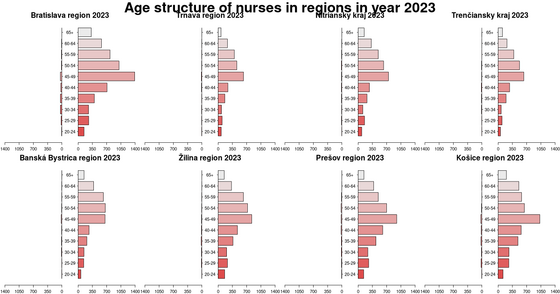
09.02.2021 (link) : Age structure of nurses in regions – Age structure of nurses in regions shows that negative demographic situation of nurses is in all regions of Slovakia . . .
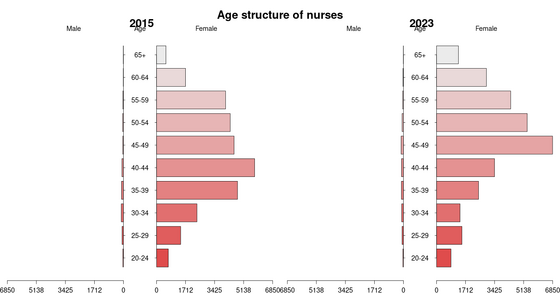
14.01.2021 (link) : Age structure of nurses – Age structure of nurses in years 2015 and 2021 according to gender . . .
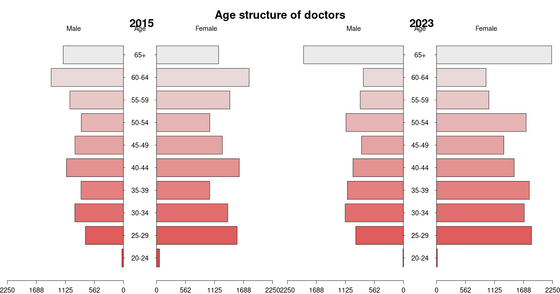
14.01.2021 (link) : Age structure of doctors – Age structure of doctors in years 2015 and 2021 according to gender . . .
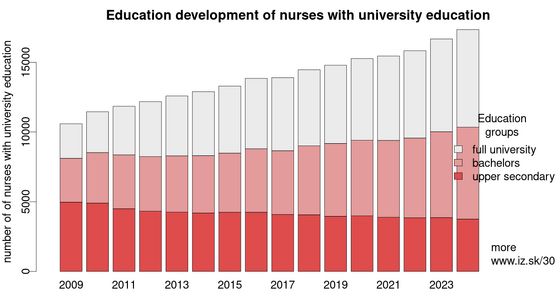
15.11.2019 (link) : Development of education structure of nurses with university education – Development of education structure of nurses with university education in Slovakia . . .
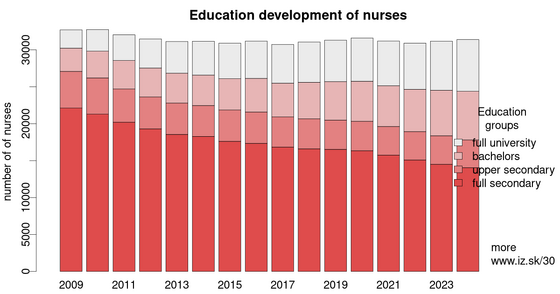
13.11.2019 (link) : Development of education structure of nurses – Development of education structure of nurses in Slovakia . . .
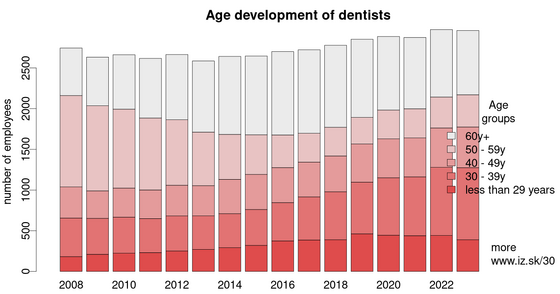
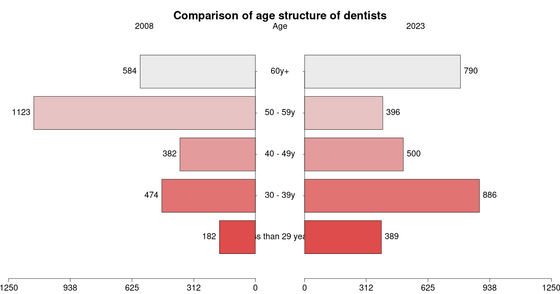
23.10.2019 (link) : Comparison of age structure of dentists – The increase of the number of dentists ha been driven by ageing of dentists (so the largest age group is 60+) and increasing number of young dentists, which is a positive sign . . .
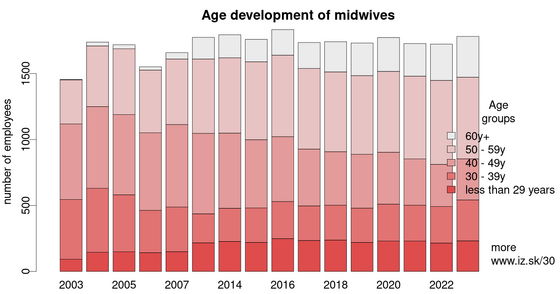
11.09.2019 (link) : Age development of midwives – Age development of midwives in Slovakia . . .
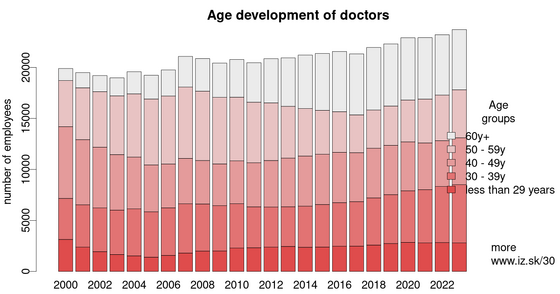
11.09.2019 (link) : Age development of doctors – Age development of doctors in Slovakia is characterized by aging of older doctors and inflow of young doctors. Middle generation is missing . . .
03.09.2019 (link) : 30 graphs on ageing – 30 graphs on ageing of population, doctors and nurses in Slovakia . . .
Suggested citation: Michal Páleník: 30 graphs on ageing - 30 graphs on ageing, IZ Bratislava, retrieved from: https://www.iz.sk/30-graphs-on-ageing, doi:10.5281/zenodo.6079128
 Tento článok je súčasťou projektu Politiky zamestnanosti realizovaného Inštitútom zamestnanosti. Tento projekt je podporený z Európskeho sociálneho fondu v rámci OP EVS.

Regularly updated
On our webpage, we have several data which are regularly updated. These include data on unemployment or legislation.. . .
 Share
Share Facebook
 Twitter
 News
News