Age development of nurses
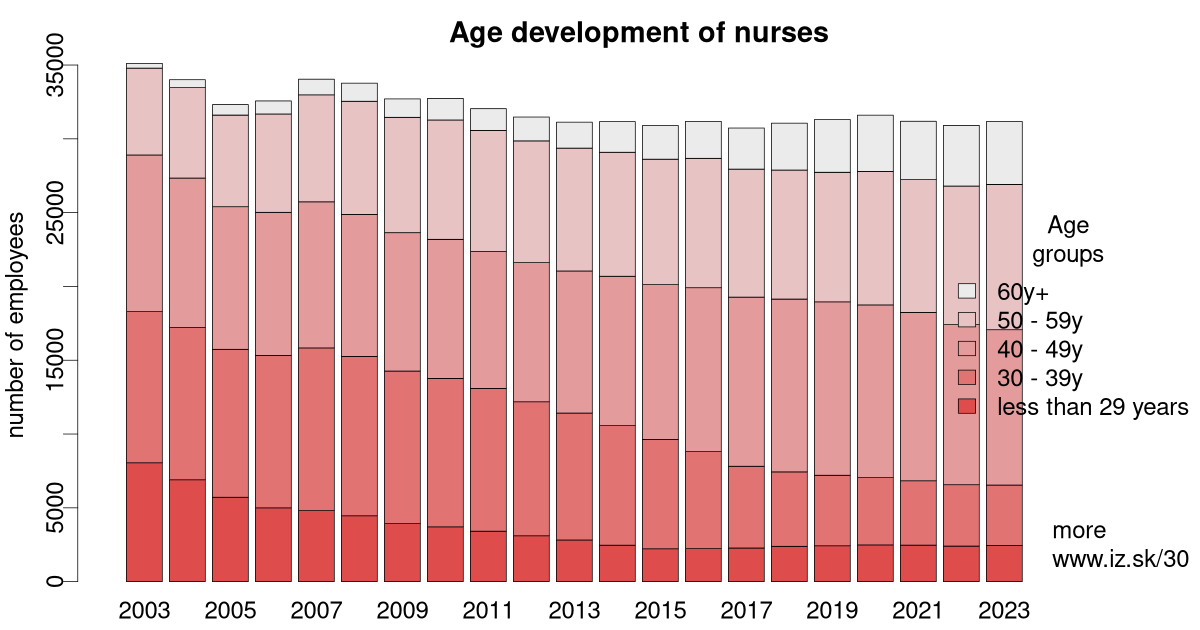
Ageing of nurses in Slovakia is faster – the number of nurses below 30 years of age has decreased by almost half. The overall number of nurses has decreased by 8 % since 2008.
| rok | less than 29 years | 30 – 39y | 40 – 49y | 50 – 59y | 60y+ | total |
|---|---|---|---|---|---|---|
| 2003 | 8053 | 10 243 | 10 610 | 5887 | 320 | 35 113 |
| 2004 | 6900 | 10 310 | 10 133 | 6134 | 530 | 34 007 |
| 2005 | 5718 | 10 022 | 9661 | 6209 | 709 | 32 319 |
| 2006 | 4999 | 10 322 | 9700 | 6664 | 883 | 32 568 |
| 2007 | 4809 | 11 025 | 9899 | 7247 | 1060 | 34 040 |
| 2008 | 4460 | 10 800 | 9623 | 7665 | 1224 | 33 772 |
| 2009 | 3933 | 10 333 | 9376 | 7816 | 1247 | 32 705 |
| 2010 | 3713 | 10 052 | 9425 | 8088 | 1461 | 32 739 |
| 2011 | 3418 | 9667 | 9274 | 8215 | 1469 | 32 043 |
| 2012 | 3107 | 9079 | 9426 | 8250 | 1616 | 31 478 |
| 2013 | 2821 | 8600 | 9625 | 8325 | 1757 | 31 128 |
| 2014 | 2471 | 8102 | 10 118 | 8399 | 2076 | 31 166 |
| 2015 | 2227 | 7403 | 10 496 | 8495 | 2283 | 30 904 |
| 2016 | 2243 | 6569 | 11 101 | 8767 | 2503 | 31 183 |
| 2017 | 2278 | 5541 | 11 457 | 8672 | 2784 | 30 732 |
| 2018 | 2394 | 5042 | 11 708 | 8743 | 3174 | 31 061 |
| 2019 | 2430 | 4777 | 11 748 | 8779 | 3575 | 31 309 |
| 2020 | 2487 | 4562 | 11 699 | 9043 | 3813 | 31 604 |
| 2021 | 2473 | 4361 | 11 403 | 9003 | 3950 | 31 190 |
| 2022 | 2409 | 4157 | 10 850 | 9386 | 4108 | 30 910 |
| 2023 | 2456 | 4087 | 10 524 | 9845 | 4262 | 31 174 |
| 2024 | 2589 | 3801 | 10 258 | 10 354 | 4393 | 31 395 |
| Mean | 3563 | 7675 | 10 369 | 8181 | 2236 | 32 025 |
Suggested citation: Michal Páleník: 30 graphs on ageing - Age development of nurses, IZ Bratislava, retrieved from: https://www.iz.sk/30-graphs-on-ageing/age-development-of-nurses, doi:10.5281/zenodo.6079128
 Tento článok je súčasťou projektu Politiky zamestnanosti realizovaného Inštitútom zamestnanosti. Tento projekt je podporený z Európskeho sociálneho fondu v rámci OP EVS.
Similar articles
Comparison of age structure of nurses and doctors, Age structure of nurses by founder, Age structure of nurses, Nurses, Development of education structure of nurses, Development of education structure of nurses with university education, Other professions in healthcare, Students of nursing, Age structure of nurses in regions
 Share
Share Facebook
 Twitter
 News
News