IZ Bratislava : Population aging : 30 graphs on ageing : Development of education structure of nurses with university education :
Development of education structure of nurses with university education
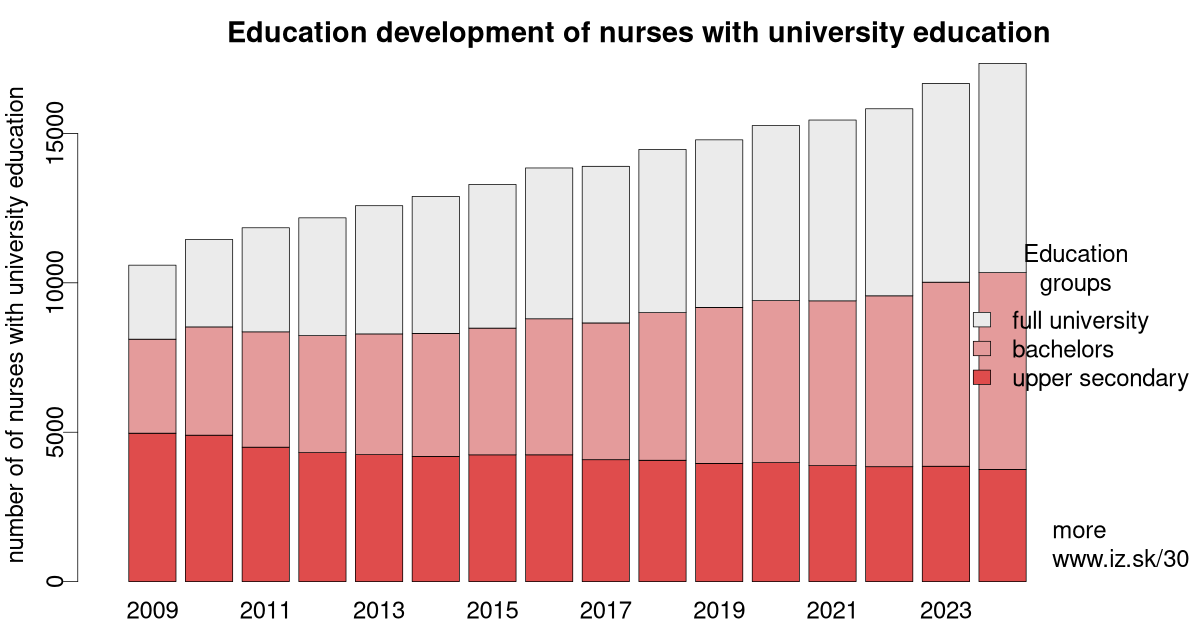
Development of education structure of nurses in Slovakia.
| rok | upper secondary | bachelors | full university | total |
|---|---|---|---|---|
| 2009 | 4967 | 3147 | 2477 | 10 591 |
| 2010 | 4901 | 3623 | 2925 | 11 449 |
| 2011 | 4499 | 3861 | 3482 | 11 842 |
| 2012 | 4317 | 3915 | 3942 | 12 174 |
| 2013 | 4250 | 4041 | 4290 | 12 581 |
| 2014 | 4188 | 4118 | 4585 | 12 891 |
| 2015 | 4243 | 4242 | 4807 | 13 292 |
| 2016 | 4244 | 4552 | 5048 | 13 844 |
| 2017 | 4081 | 4576 | 5241 | 13 898 |
| 2018 | 4061 | 4945 | 5458 | 14 464 |
| 2019 | 3956 | 5221 | 5607 | 14 784 |
| 2020 | 3986 | 5419 | 5858 | 15 263 |
| 2021 | 3882 | 5515 | 6050 | 15 447 |
| 2022 | 3847 | 5718 | 6260 | 15 825 |
| 2023 | 3861 | 6161 | 6647 | 16 669 |
| 2024 | 3753 | 6589 | 7002 | 17 344 |
| Mean | 4190 | 4728 | 4980 | 13 897 |
Suggested citation: Michal Páleník: 30 graphs on ageing - Development of education structure of nurses with university education, IZ Bratislava, retrieved from: https://www.iz.sk/30-graphs-on-ageing/development-education-of-nurses-with-uni, doi:10.5281/zenodo.6079128
 Tento článok je súčasťou projektu Politiky zamestnanosti realizovaného Inštitútom zamestnanosti. Tento projekt je podporený z Európskeho sociálneho fondu v rámci OP EVS.
https://www.iz.sk/30-graphs-on-ageing/development-education-of-nurses-with-uni
 Share
Share Facebook
 Twitter
 News
News