Age structure of nurses by founder
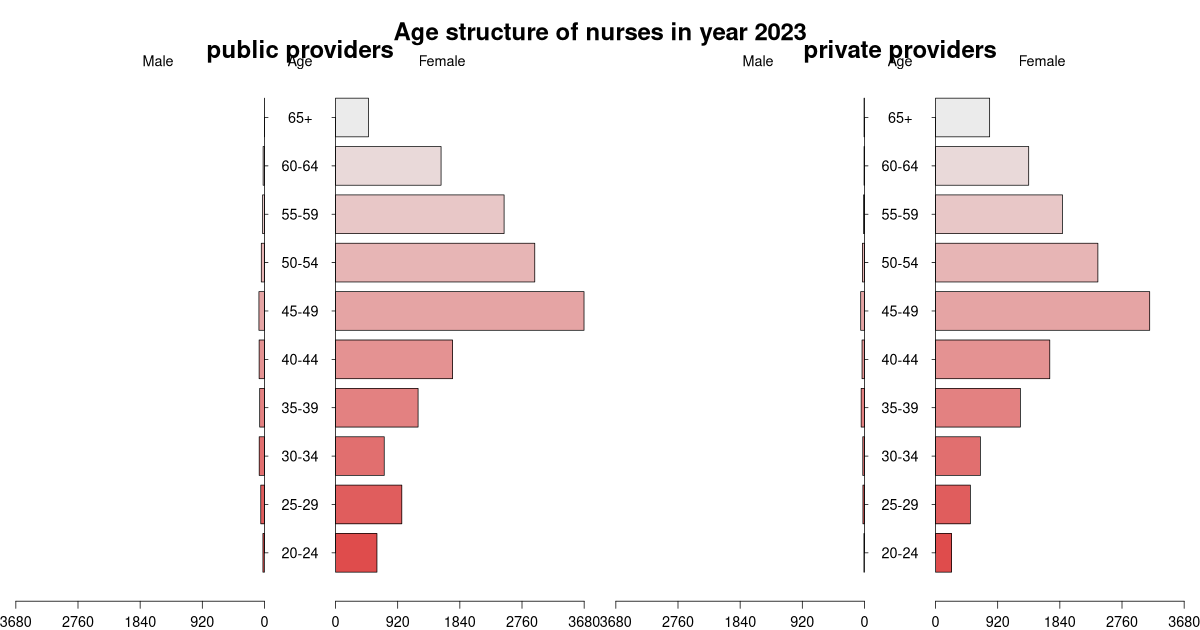
Age structure of nurses by founder type – either public providers or privately owned providers.
| age | male public providers | female public providers | total public providers | male private providers | female private providers | total private providers | total |
|---|---|---|---|---|---|---|---|
| 20-24 | 27 | 601 | 628 | 12 | 247 | 259 | 887 |
| 25-29 | 61 | 1044 | 1105 | 34 | 563 | 597 | 1702 |
| 30-34 | 69 | 766 | 835 | 26 | 659 | 685 | 1520 |
| 35-39 | 81 | 1062 | 1143 | 45 | 1093 | 1138 | 2281 |
| 40-44 | 80 | 1769 | 1849 | 55 | 1723 | 1778 | 3627 |
| 45-49 | 88 | 3522 | 3610 | 56 | 2965 | 3021 | 6631 |
| 50-54 | 48 | 3144 | 3192 | 36 | 2593 | 2629 | 5821 |
| 55-59 | 35 | 2575 | 2610 | 14 | 1909 | 1923 | 4533 |
| 60-64 | 19 | 1585 | 1604 | 6 | 1346 | 1352 | 2956 |
| 65+ | 3 | 558 | 561 | 9 | 867 | 876 | 1437 |
| Total | 511 | 16 626 | 17 137 | 293 | 13 965 | 14 258 | 31 395 |
Suggested citation: Michal Páleník: 30 graphs on ageing - Age structure of nurses by founder, IZ Bratislava, retrieved from: https://www.iz.sk/30-graphs-on-ageing/age-structure-of-nurses-by-founder, doi:10.5281/zenodo.6079128
https://www.iz.sk/30-graphs-on-ageing/age-structure-of-nurses-by-founder
Similar articles
Nurses, Students of nursing, Other professions in healthcare, Comparison of age structure of nurses and doctors, Age structure of nurses, Age development of nurses, Development of education structure of nurses with university education, Development of education structure of nurses, Age structure of nurses in regions
 Share
Share Facebook
 Twitter
 News
News