IZ Bratislava : Population aging : 30 graphs on ageing : Comparison of age structure of nurses and doctors :
Comparison of age structure of nurses and doctors
Comparison of age structure of nurses and doctors in Slovakia.
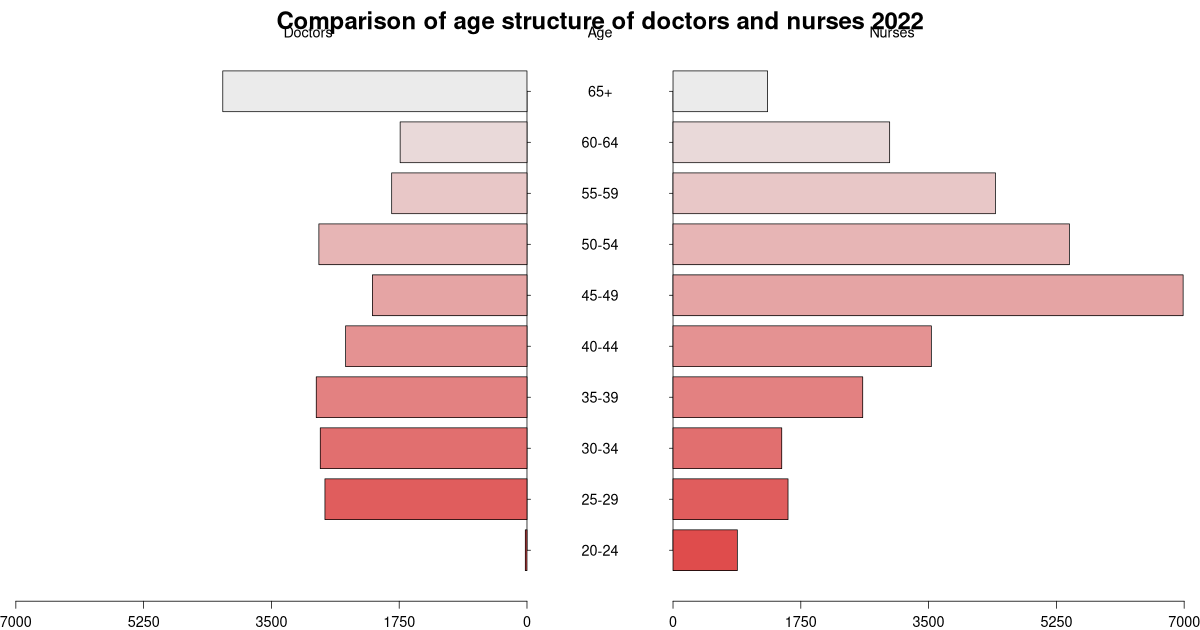
| vek | Doctors 2024 | Nurses 2024 | total |
|---|---|---|---|
| 20-24 | 20 | 887 | 907 |
| 25-29 | 2854 | 1702 | 4556 |
| 30-34 | 3125 | 1520 | 4645 |
| 35-39 | 2933 | 2281 | 5214 |
| 40-44 | 2719 | 3627 | 6346 |
| 45-49 | 2085 | 6631 | 8716 |
| 50-54 | 2856 | 5821 | 8677 |
| 55-59 | 1976 | 4533 | 6509 |
| 60-64 | 1664 | 2956 | 4620 |
| 65+ | 4137 | 1437 | 5574 |
| Total | 24 369 | 31 395 | 55 764 |
Suggested citation: Michal Páleník: 30 graphs on ageing - Comparison of age structure of nurses and doctors, IZ Bratislava, retrieved from: https://www.iz.sk/30-graphs-on-ageing/comparison-of-age-structure-nurses-doctors, doi:10.5281/zenodo.6079128
https://www.iz.sk/30-graphs-on-ageing/comparison-of-age-structure-nurses-doctors
Doctors
How does the structure and age of doctors change? How did the structure of medicine students change?. . .
Similar articles
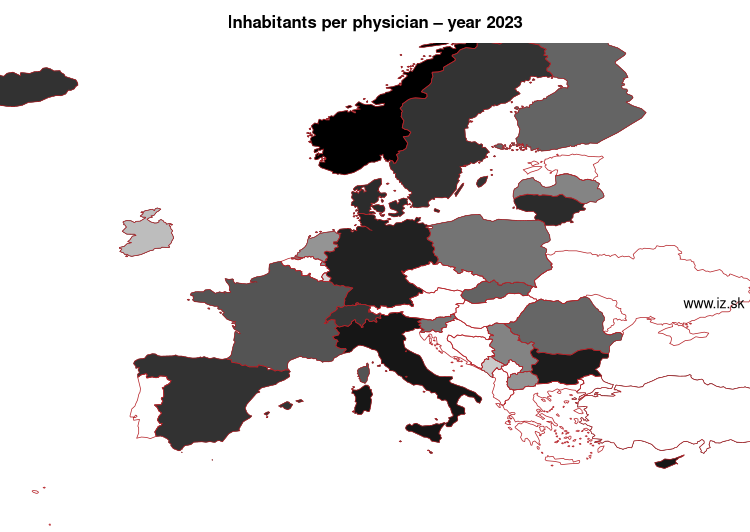
Age structure of doctors in regions, Number of health care employees, Age structure of doctors, Number of medicine students, Age structure of doctors by founder, Doctors, The impact of aging on the health care sector in Slovakia – forecast of demand and supply until 2030 .pdf, Inhabitants per physician – year 2024
Navigation:
- Short news
- Local Administrative Units data of Visegrad countries open data
- Projects and activities
- European regions
- Random region: Austria, Western Austria, Tyrol, Innsbruck
 Share
Share Facebook
 Twitter
 News
News