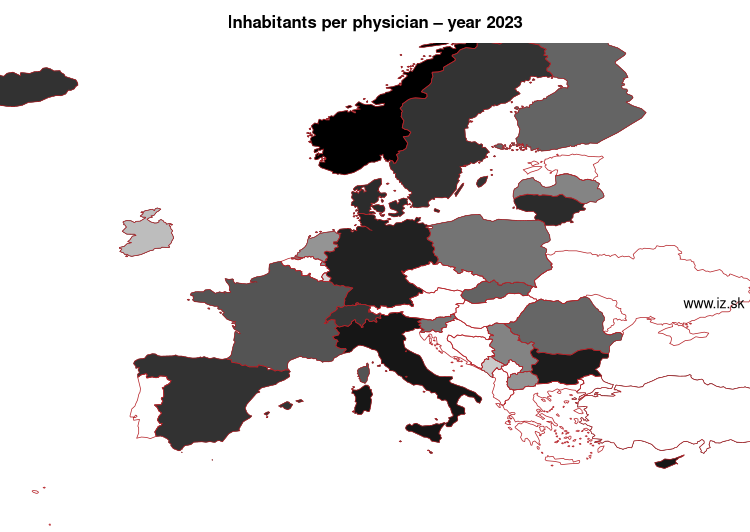
Inhabitants per physician – year 2024
| Order | Code | Region | Value | Note |
|---|---|---|---|---|
| 1. | Norway | NO | 160,33 | |
| 2. | Italy | IT | 171,79 | |
| 3. | Cyprus | CY | 181,5 | |
| 4. | Bulgaria | BG | 189,45 | period 2025 |
| 5. | Germany | DE | 191,92 | |
| 6. | Denmark | DK | 200,38 | |
| 7. | Spain | ES | 200,8 | |
| 8. | Iceland | IS | 203,05 | period 2025 |
| 9. | Lithuania | LT | 204,44 | |
| 10. | Sweden | SE | 205,67 | |
| 11. | Switzerland | CH | 211,41 | |
| 12. | Malta | MT | 214,01 | |
| 13. | France | FR | 243,97 | |
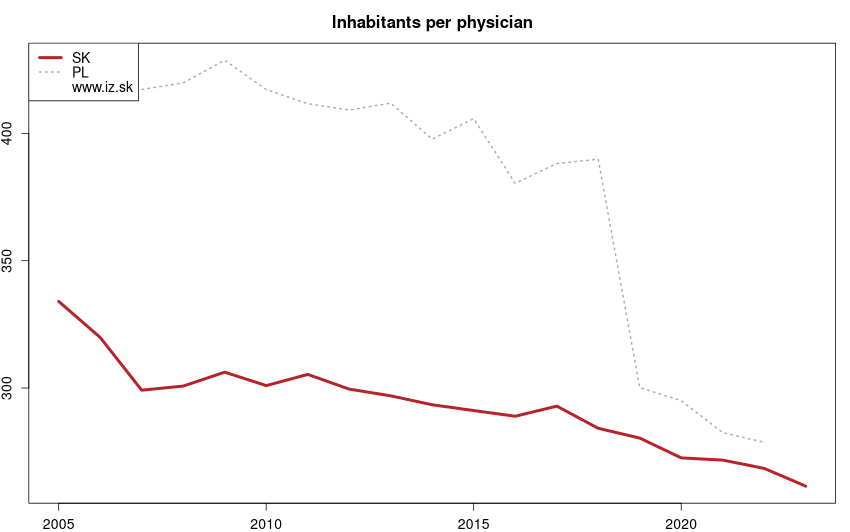
| 14. | Slovakia | SK | 253,33 | |
| 15. | Poland | PL | 256,65 | |
| 16. | Romania | RO | 258,12 | |
| 17. | Finland | FI | 259,52 | period 2025 |
| 18. | Slovenia | SI | 274,11 | |
| 19. | Serbia | RS | 288,48 | |
| 20. | Latvia | LV | 291,03 | |
| 21. | Liechtenstein | LI | 293,12 | |
| 22. | Netherlands | NL | 301,8 | period 2013 |
| 23. | North Macedonia | MK | 309,21 | period 2021 |
| 24. | Luxembourg | LU | 325,33 | period 2012 |
| 25. | Ireland | IE | 329 | period 2013 |
| 26. | Montenegro | ME | 364,18 | period 2019 |
| 27. | Turkey | TR | 386,73 |
Data for the period year 2024. Source of the data is Eurostat, table [hlth_rs_prs2].
See also:
Suggested citation: Michal Páleník: 30 graphs on ageing - Inhabitants per physician – year 2024, IZ Bratislava, retrieved from: https://www.iz.sk/30-graphs-on-ageing/inhabitants-per-physician, doi:10.5281/zenodo.6079128
https://www.iz.sk/30-graphs-on-ageing/inhabitants-per-physician

Navigation:
- Short news
- Local Administrative Units data of Visegrad countries open data
- Projects and activities
- European regions
- Random region: Austria, East Austria, Wien
 Share
Share Facebook
 Twitter
 News
News